Setting up System Diagnostics in TIA Portal V17 Using WinCC Professional

Introduction
In today's world of ever-increasing reliance on machine automation, we rely heavily on fault identification through alarms. However, one area that can be overlooked is the diagnostic information of cards in racks and devices on the network.
If, for example, an analog input card in a rack has failed, we might see the analog readings on that card show an open loop, which would likely generate alarms. These alarms can point to where there may be an issue but not specifically identify it, meaning it may take some time to locate the source of the problem.
With System Diagnostics, we can quickly see if the problem is with the hardware in the rack rather than in the field. This information is detailed enough to pinpoint exactly where the issue is generated from and exactly what the problem is i.e., fuse failed.
In this tutorial, we will look at setting up system diagnostics in TIA Portal V17 using WinCC Professional to display our diagnostic information. The process is a little different on the older generation of CPUs (S7-300’s and S7-400’s) versus the newer S7-1500s, so we will look at how to configure the diagnostic information.
Note: To get diagnostic information from an S7-1200, we need to use a different method, configuring function blocks and manually adding information.
Enabling System Diagnostics
By default, S7-1500 series PLCs have System Diagnostics enabled, and we cannot disable this. Because of this, we don’t need to do any further configuration and can skip to the next section where we will set up the network configuration.
To enable System Diagnostics on an S7-300 series PLC, we must navigate to the CPU properties and, on the General Tab, select “System Diagnostics”
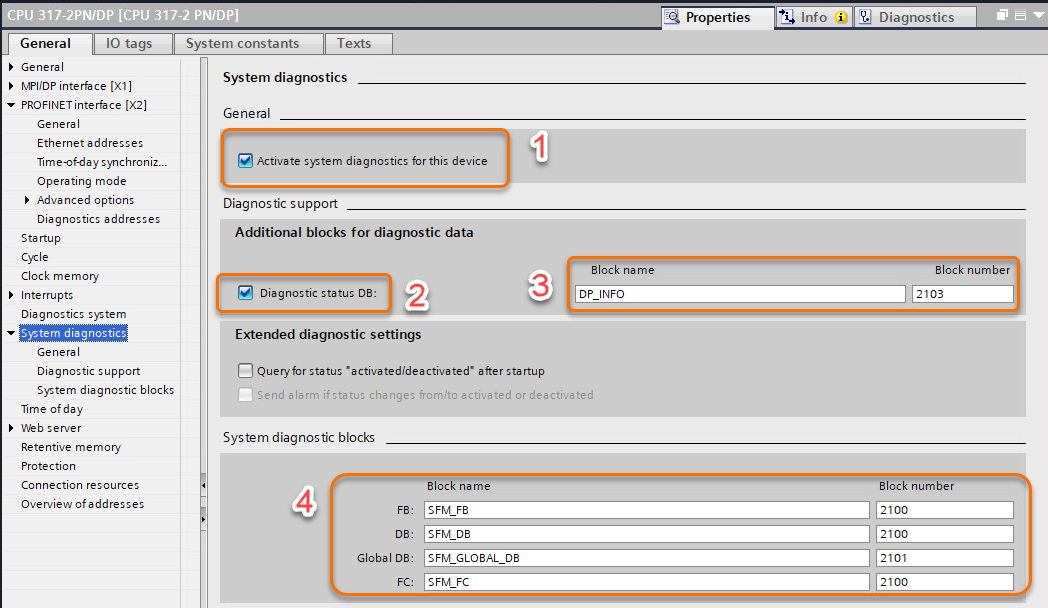
Selecting the checkbox (1) will activate the System Diagnostics for this device and its connected devices.
Within system diagnostics, we have the option to create a Status data block which is updated by the system diagnostics blocks to detail the current system status. The created data block allows us to query the system state of a configured component and its lower-level components. To enable this, select the checkbox (2). We can give the status block a suitable name and block number by editing the data under “Diagnostic support” highlighted in (3).
When generating our System Diagnostics blocks we can give them suitable names and block numbers by editing the data under the “System diagnostics blocks” highlighted in (4).
Setting up the Network Configuration
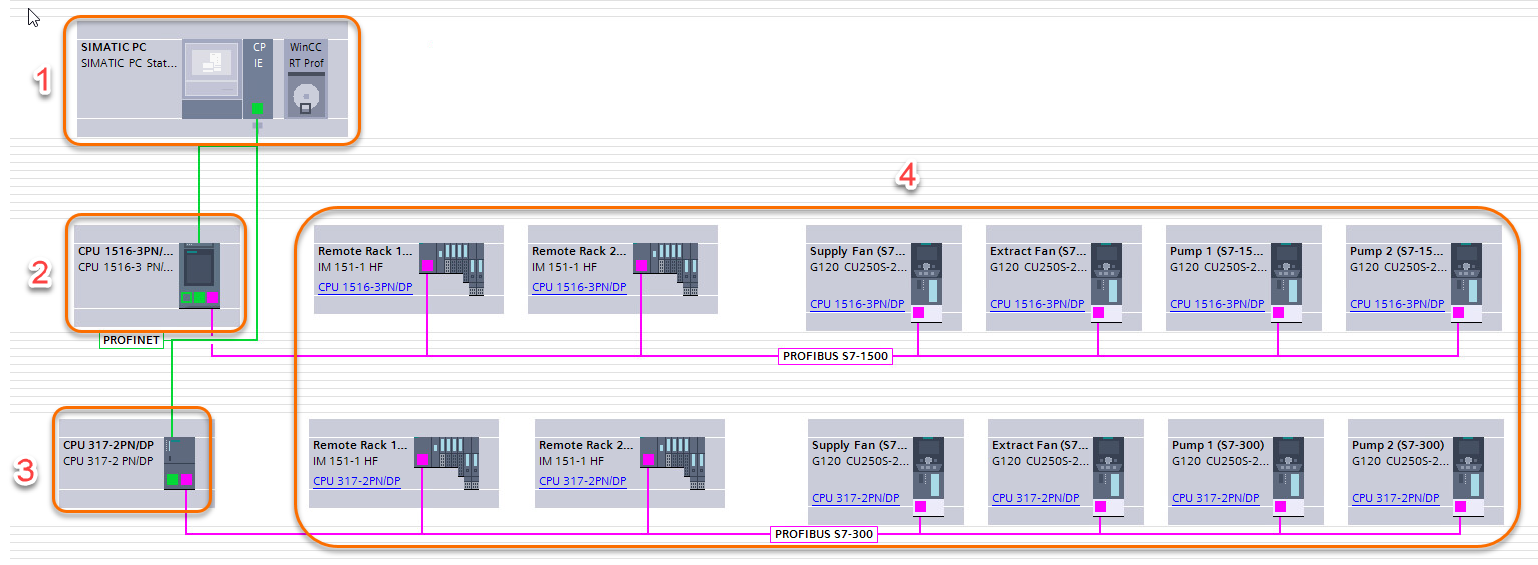
We need to identify the components that will go into making our system. At the network level; we capture the HMI or PC Station (1). This will connect to the S7-1500 PLC (2) and the S7-300 PLC (3) using Profinet, indicated by the green line. Then we have two remote racks and four VSDs (4). These connect to the PLC using Profibus, indicated by the purple line. The Profibus arrangement is duplicated for each of the PLCs in this case.
The green Profinet line connects the HMI Station and both PLCs indicating they are all on the same Profinet subnet. There are two separate purple lines, one connecting a Profibus network to the S7-1500 PLC and one connected to the S7-300 PLC. This indicates that they are two completely separate Profibus networks uniquely assigned to a single PLC.
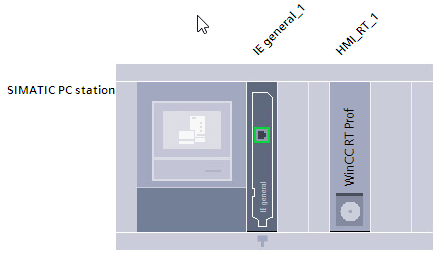
The HMI Station itself consists of a WinCC RT Professional module and an IE General device to connect it up to our Profinet network.
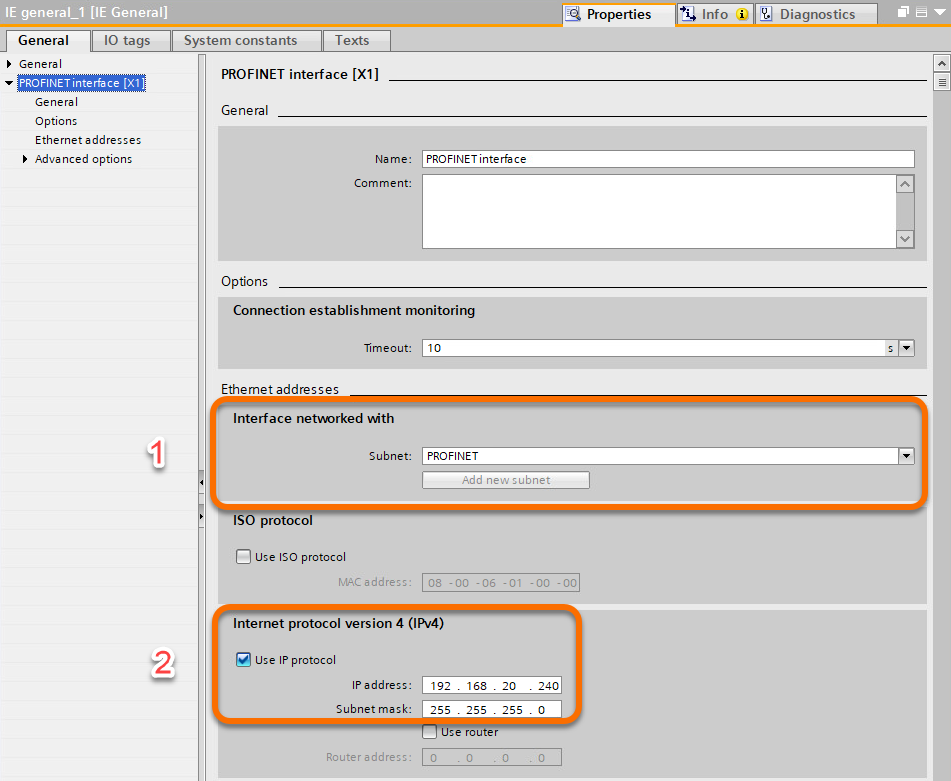
We need to configure our IE General device to create a Profinet subnet (1) and give it an appropriate Ethernet address (2). This is the subnet that our PLCs will connect to.
On the PLC racks, we have three Digital Input Cards and two Analogue Input cards set up on each system, but of course, this could be any configuration. Our Remote Racks are configured with two Digital Input cards on Remote Rack 1, and two Digital Output cards on Remote Rack 2.
Generating the Diagnostics Blocks
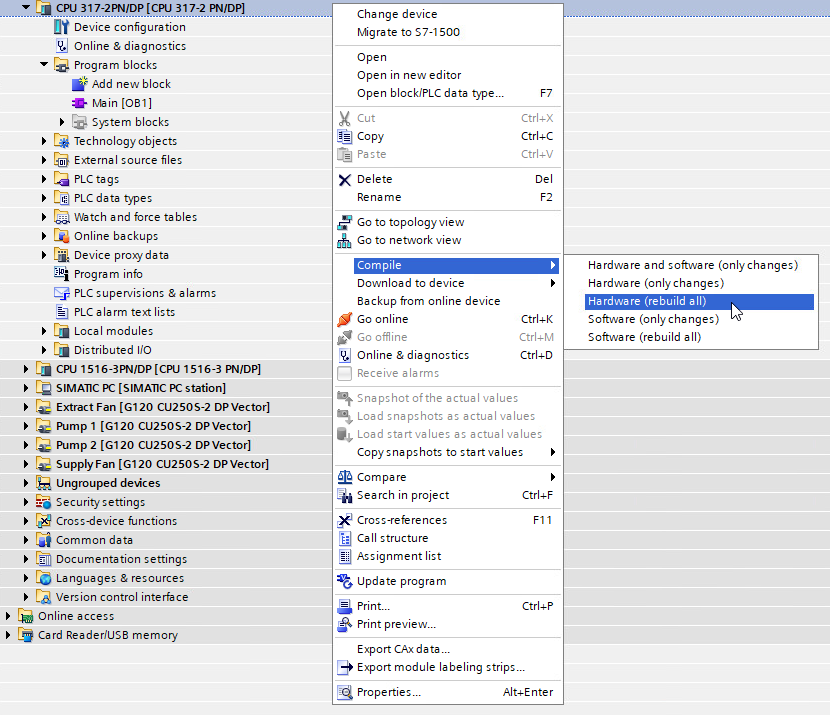
To generate the diagnostics block for our entire system, we must compile the hardware. Right-click the CPU and navigate to “Compile” and then “Hardware (rebuild all). This will do a complete compilation and create our System Blocks.
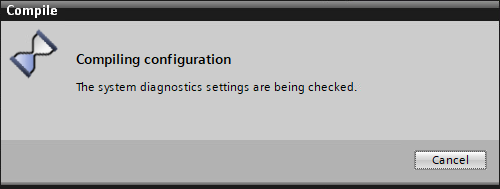
When we select this, we are shown the following box detailing the diagnostics being checked.
Now that we have compiled the CPU, we can see that Organizational Blocks “I/O_FLT1” (OB82), “I/O_FLT2” (OB83), “OBNL_FLT” (OB85), and “RACK_FLT” (OB86) have been generated for us, (1).
We can also see that our diagnostics blocks have been created using the names and block numbers we assigned earlier under “System Blocks” - “System diagnostics”, (2).
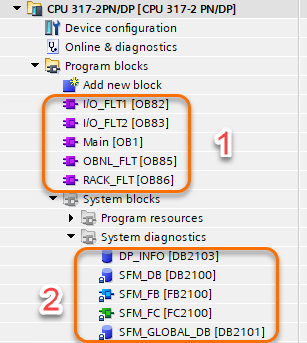
OB82 is a Diagnostic Interrupt Organizational Block. If the diagnostic interrupt detects a change, it sends an interrupt request to the CPU.
OB83 is an Insert or Remove Module Interrupt. The CPU will call OB82 after a configured module has been pulled out or plugged in.
OB85 is a Priority Class Error Organizational Block. The CPU will call OB85 whenever any of our other Organizational Blocks are operated. The Interrupt priority can be modified in the CPU properties.
OB86 is a Rack Failure Organizational Block. If a configured expansion unit, DP Master System, Profinet, or Profibus distributed device fails, the CPU will call OB86.
Configuring a WinCC Station
Now that we have compiled our PLCs with our System Diagnostics, we need a method of displaying our alarms and diagnostics. To do this, we will create an application with three simple screens.
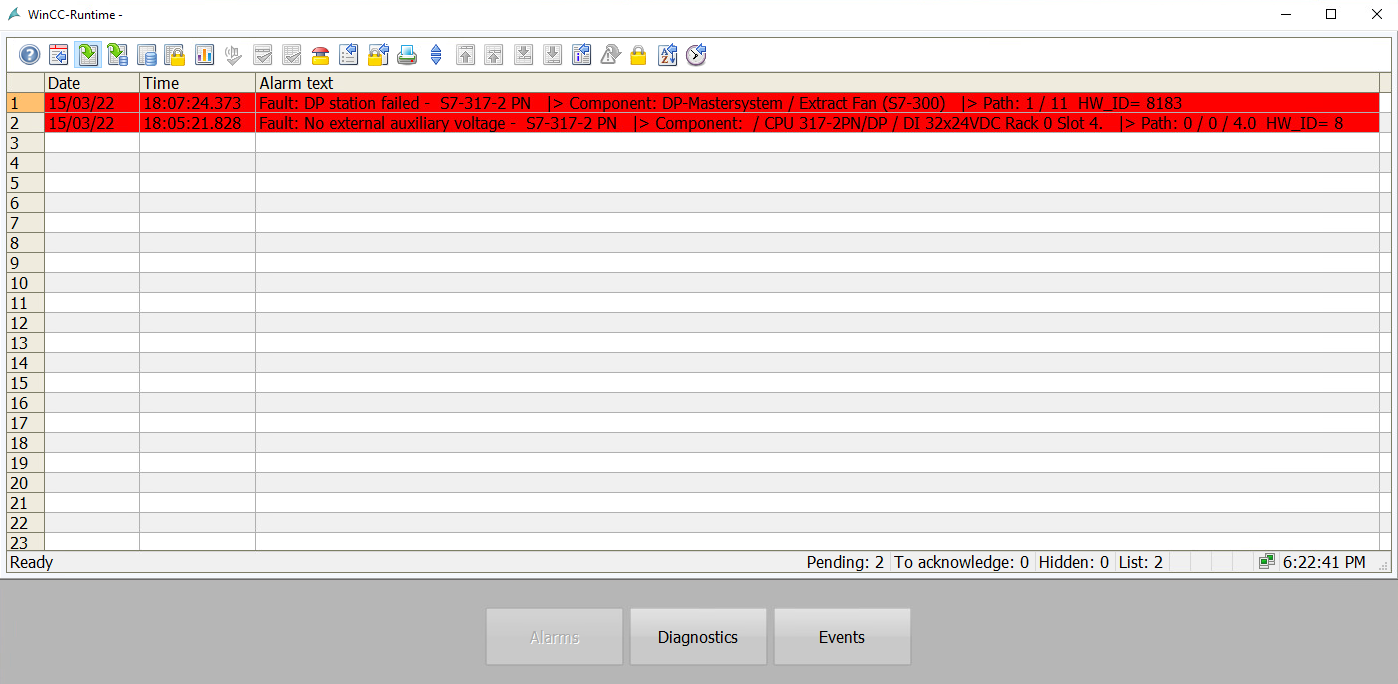
First up we need an Alarms screen. This screen will show us our “Pending alarms” and show us the Date and Time the alarm occurred along with the Alarm text which will detail what and where the issue is, including where in which rack or slot.
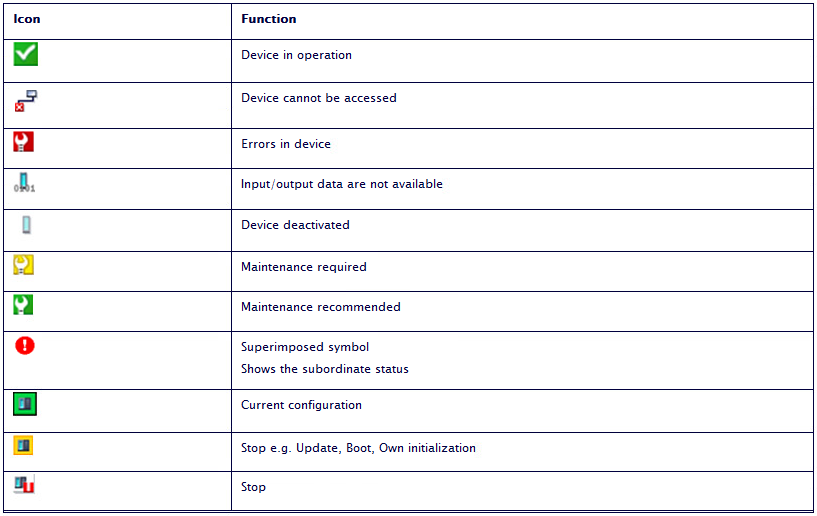
The Diagnostics page will show us the whole system, including the PLC, cards, and remote racks, with visual indicators as to the current state of the equipment.
The final screen we will have is an Event Log that will show the “Historical alarm list (long-term)” to record the alarms we have previously had.
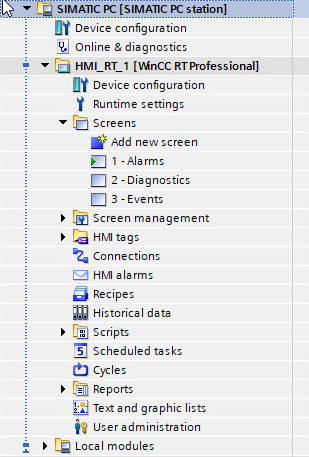
Win the SIMATIC Station, we have configured a Runtime HMI (WinCC RT Professional)
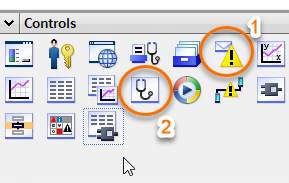
For our Alarm Screen, we will use the item from the toolbox marked (1) below. We will use the item from the toolbox marked (2) below for the Diagnostics Screen. Finally, for our Event Log Screen, we will again use the item from the toolbox marked (1) below.
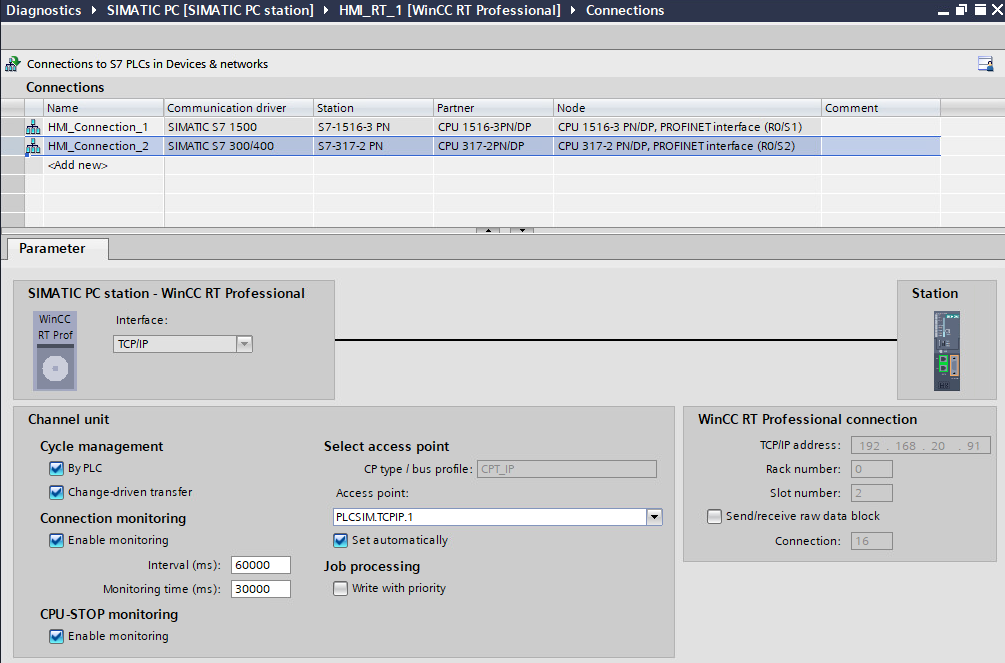
In the HMI Connections window, you can see that the HMI has a connection to each PLC, the S7-1500 and the S7-300.
HMI Runtime Simulation
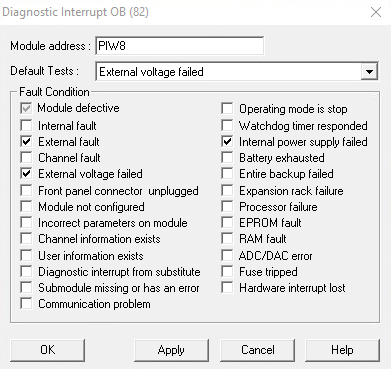
It is possible to simulate a Diagnostic Interrupt using PLCSIM. Type in the “Module Address”. PIW8 is the I/O address of the first digital input card in Slot 4 on Rack 0. By selecting the “Default Tests” in PLCSIM Diagnostic Interrupt window to “External Voltage Failed” and clicking “Apply”, we can simulate this fault.
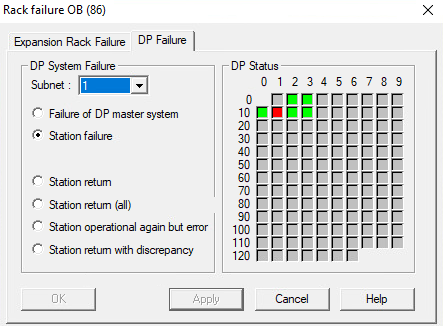
Similarly, by selecting Profibus node 11 to “Station Failure” on the “Rack Failure” window and clicking “Apply,” we can simulate a fault with the VSD - Extract Fan.
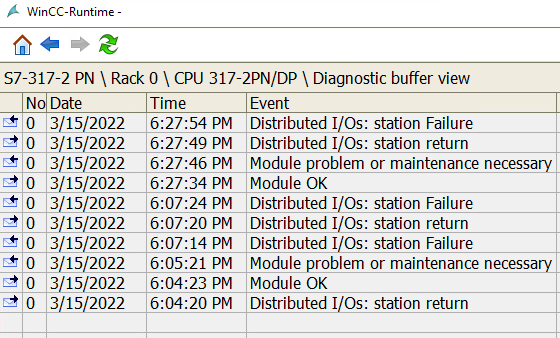
These two alarms are shown in the image below.
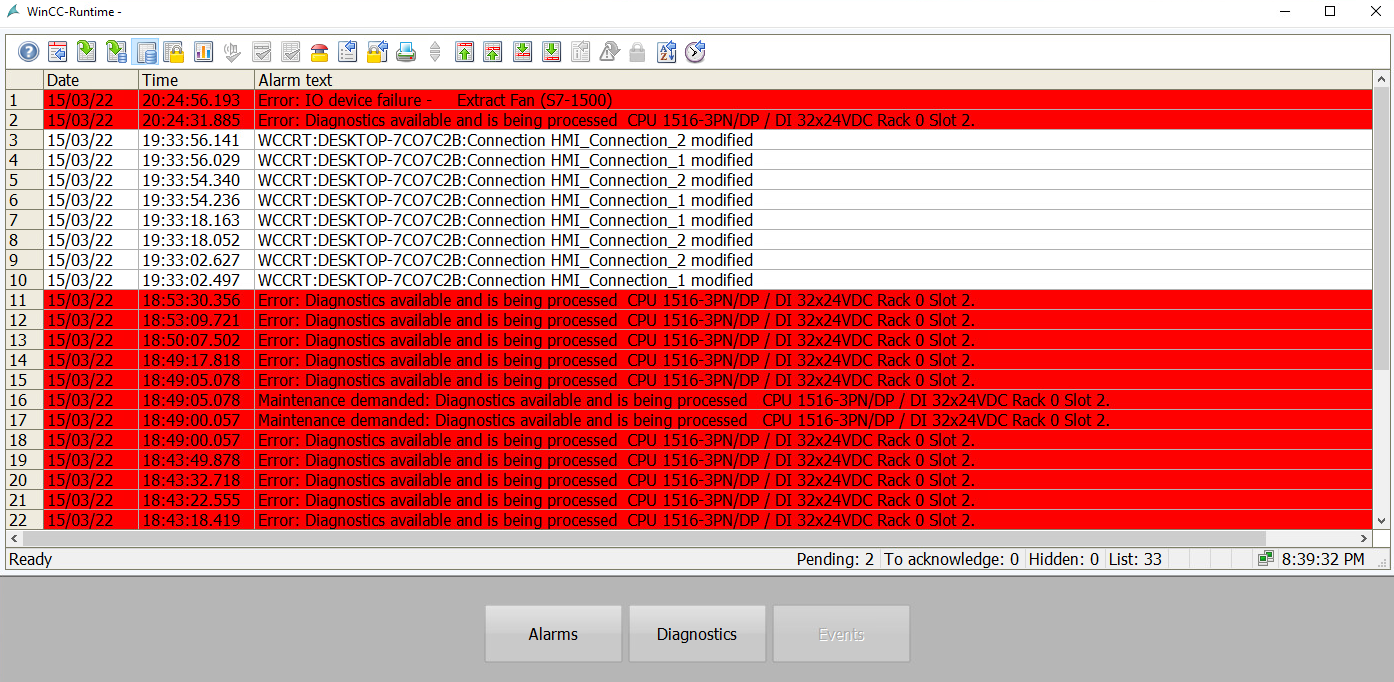
Here we can see the Event Log, containing the alarms seen above but retained for the archives. There are two entries for each alarm. One is when the alarm “came-in” and the other when it “went-out”. It also contains other events such as when screens are modified or settings changed. If we had a facility to allow different users to log in and change settings, the current user, old value, and new value would be recorded.
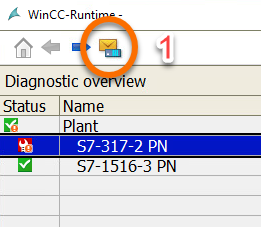
Selecting the icon shown above (1) will bring up the diagnostics information of the CPU.
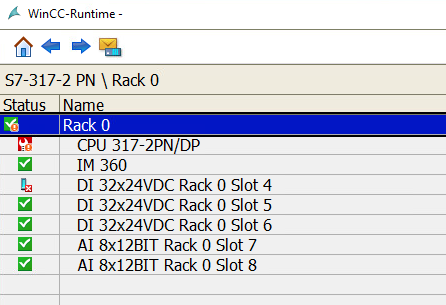
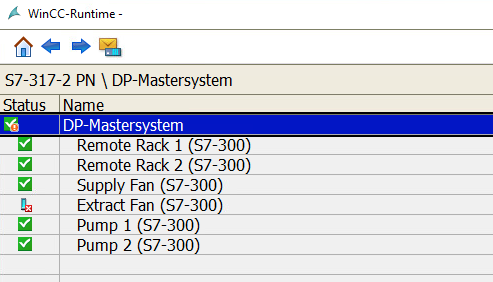
We can interrogate the source of the error by following the error icons down to the lowest level. For example, in the image below, we can see that the DI card in Rack 0 Slow 4 is the card in error, which matches what we triggered using PLCSIM.
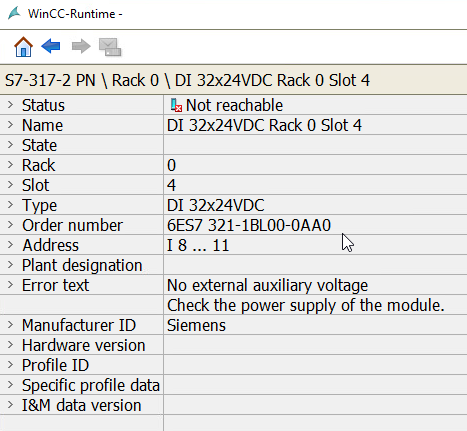
We can see the error text and other useful information such as the part order number and possible fault solution by selecting the card again, like in the image below.
Conclusion
In this tutorial, we learned how to configure System Diagnostics with Siemens S7-300, S7-400, and S7-1500 CPUs. We can configure diagnostics for S7-1200 CPUs, but the process is more involved and requires the inclusion of additional Function Blocks and Data Blocks. With S7-1500 CPUs, the diagnostics are turned on by default, and we cannot turn it off. Therefore, there is far less configuration required. With S7-300s or 400s, we must turn diagnostics on and configure the block names and numbers we would like to use.
We set up our hardware, a SIMATIC WinCC Professional Run Time device and configured a Subnet for our PLCs to connect to. We also added some I/O cards and a Profibus Master System to allow us to read the diagnostics information from multiple sources.
We created three screens on our HMI: One to display the Pending Alarms, one to Show the Diagnostics screen, and the final one to display the Long term archive Event Log.
Using PLCSIM, we triggered some diagnostic faults from a card mounted on the PLC rack and from the Profibus Master System. We were then able to interrogate the system to find the fault's source and possible rectification information.
