Siemens PLC Troubleshooting Using Traces in TIA Portal

Introduction
In many instances, a system or machine will report an error that is difficult to diagnose by looking only at the PLC code. In these situations, you will observe the problem but you won’t be able to pinpoint its root cause. This will result in a lot of time and effort in troubleshooting the problem.
To help you with these situations, TIA Portal V17 comes with the Traces tool. It is a data recorder presented in the form of graphs, which can be saved on the controller's memory card and used for troubleshooting. It is simple to configure and will help you significantly reduce your debugging time.
In this tutorial, we will explore the Traces feature in TIA Portal V17. We will start by discussing what a Trace is, how to set up and work with one, and finally, we will go over a practical field example.
Prerequisites
To follow along with this tutorial, you will need to be online and connected to a Siemens PLC via TIA Portal V17. Note that it is possible to use Traces with S7-PLCSIM Advanced V4.0.
Understanding Traces in Siemens TIA Portal V17
A Trace is going to produce a graph that presents a value over time for one or several defined tags. It is possible to define up to a maximum of 16 tags in a Trace. All global PLC tags of elementary data types can be traced.
Setting up a Trace in Siemens Tia Portal
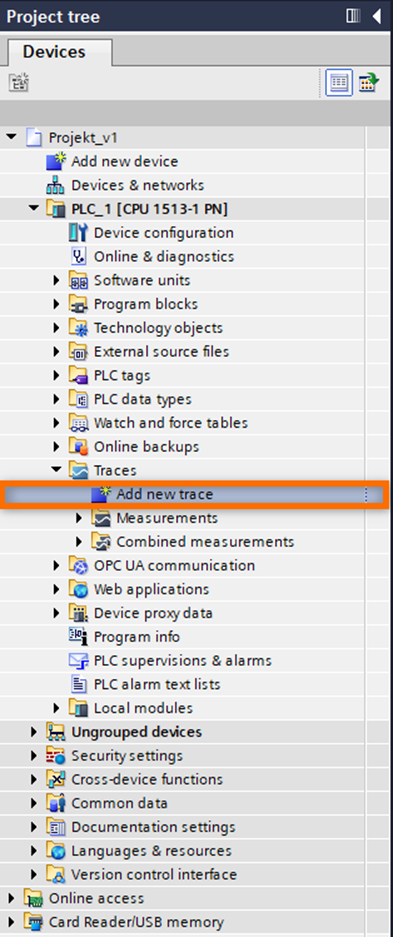
In order to create a new trace, we have to create a configuration by selecting the Add new trace option in the Project Tree. This will open a configuration window for the newly created Trace.
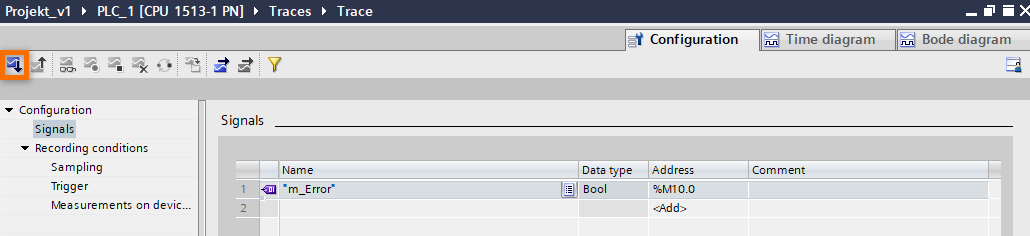
Step 1 – Define your signals
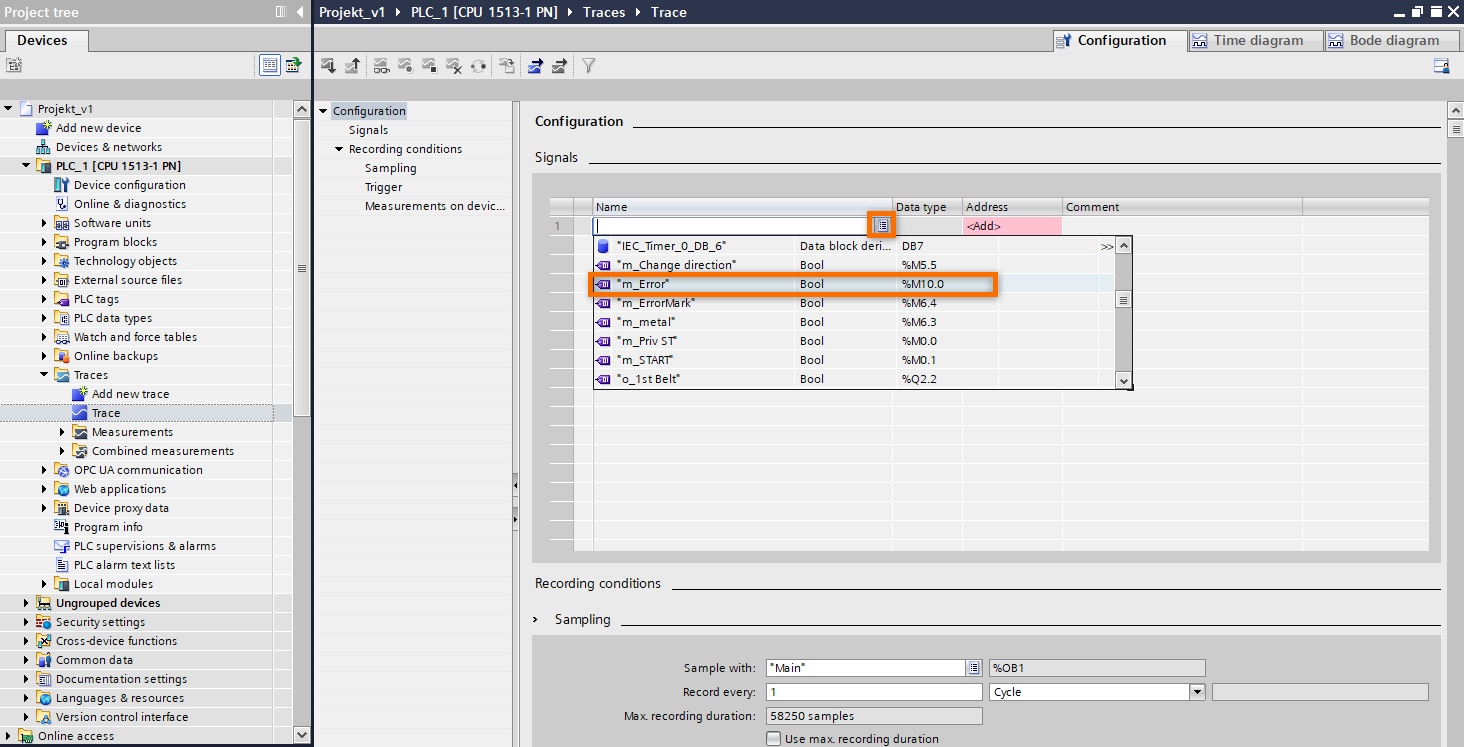
The first step in setting up your Trace is to select your signals. Signals are considered to be variables that are defined in the PLC tags tables. It is possible to refer to the variables in the Data Blocks and in the Data Instances of the function blocks as well, as long as those variables are of an elementary data type. In the configuration window, we have to determine signals that we would like to trace.
Step 2 – Choose your sampling interval
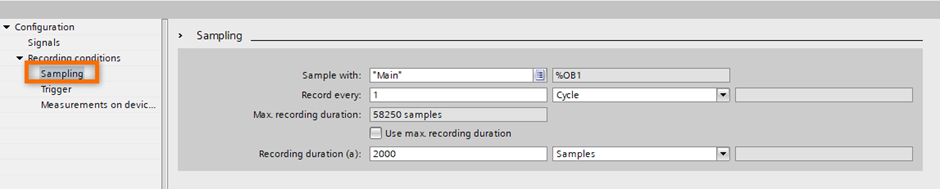
In the “Sampling” tab you have to define the sampling interval. It is defined as the interval between two recordings of the trace signal. It is possible to define the OB block with which the data will be synchronized. OB is an abbreviation for Organization Blocks. Those are the blocks that are being called directly by the PLC and they control whole program execution. Specifying different sampling OB can be used for some specific applications, but in most cases, it is enough to use standard settings.
When it comes to the duration of the trace recording, it depends on the cycle time of the PLC. If you would like to monitor some specific scenario during a live connection the easiest way is to tick the Use max. recording duration option.
As an example, if the cycle time of the PLC is around 1 millisecond, then in this case the trace will take up to 58 seconds long (58250 samples). It is always possible to stop the trace during the recording. Note that you can trigger a trace event and store the data on the PLC. Adjust the sampling settings based on your application.
Step 3 – Configuring trigger events
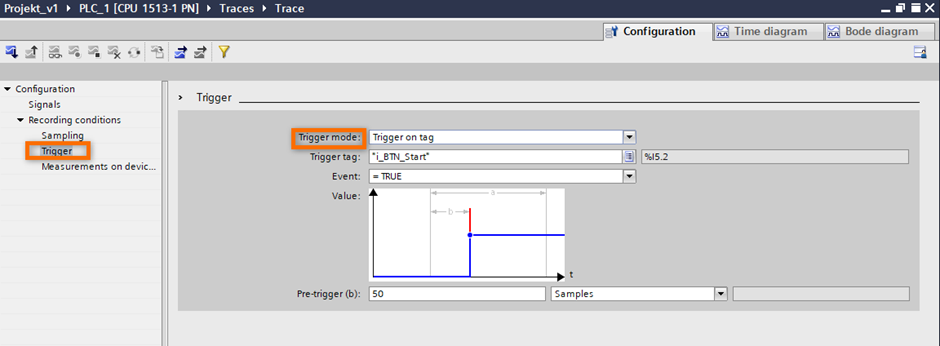
The next step is to define if you would like to use the Trigger option. Two options are available:
- Record immediately – The recording starts as soon as we press the start button. It lasts for the duration of the defined Max. recording duration, unless it is interrupted. Use this option during live process monitoring.
- Trigger on tag – The recording starts based on a user defined event. For instance when the defined error occurs (signal changes state from FALSE to TRUE). Use this option to monitor specific events and record data around their change.
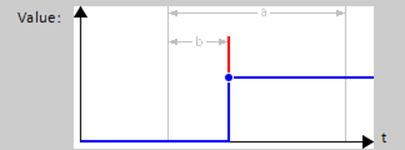
We will now look at the configuration of the Trigger on tag option. In the chart, we can see the relation of the value of the trigger to time. The blue line represents the monitored trigger value. The red line indicates when there was a value change. We can define two parameters as on the chart above.
- a – Recording duration, this is the value that we have defined in the previous step.
- b – pre-trigger, determines how many of the samples recorded before the trigger event occurs are going to be saved.
Pre-trigger functionality is handy for tracing which signal created an error that we used as an event trigger. In this example, we know which error is being triggered, but we do not know which signal caused it. That is why we would like to select the most probable signals and monitor their behavior just before the error has occurred.
Step 4 – Saving measurement on the device
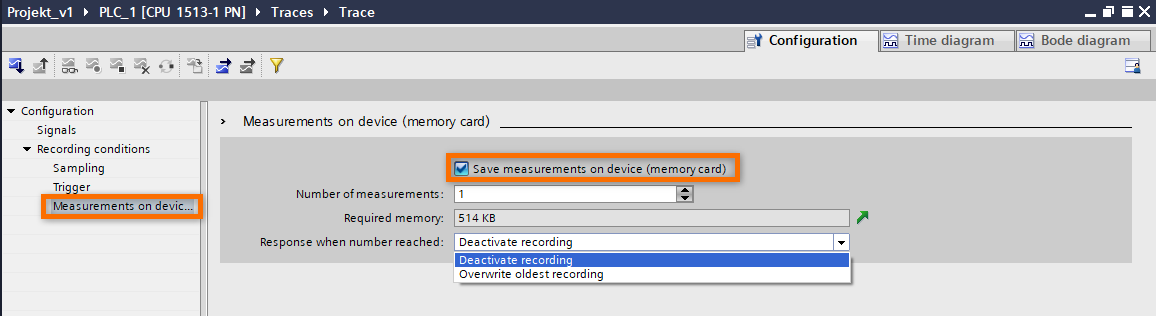
The Last step in the Trace configuration is to define if you would like to store the completed measurements on the memory card. It is a valuable option in the case of setting up a trace with trigger conditions to keep multiple results. After the following configuration is made and activated, we can disconnect from the PLC. Results will be stored in the memory card, and we will be able to check them later.
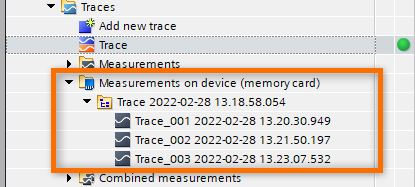
If we decide to use this feature, we first have to define the number of measurements that we would like to store on the memory card. Based on that number, the Required memory value will adjust automatically. It is an expected memory requirement for a defined number of measurements. It is possible to view those results only with an online connection to the PLC.
Additionally, we can define the behavior once the "Number of measurements" is reached.
The following settings are possible:
- Deactivate recording - the recording will end at the moment when the last file is created. In other words, measurements are repeated and stored until the "Number of measurements" is reached. This is a recommended option if we would like to have more than one measurement in order to compare the behavior of the signals. On top of that, there is no risk of damaging the memory card.
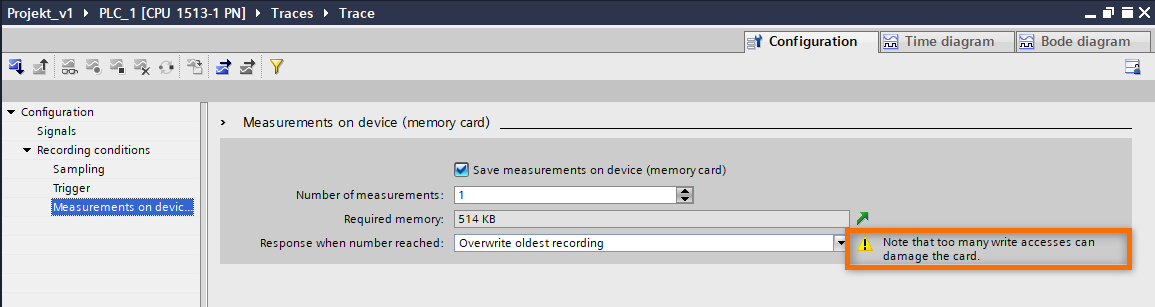
- Overwrite the oldest recording - the recording will take place continuously and the oldest file will be overwritten with new data. The process will be repeated until the user deactivates the recording. When this option is chosen, there is an important note mentioned that “too many write accesses can damage the card”. That is why I would personally discourage the usage of this option.
Step 5 – Downloading a Trace
When you have completed the configuration of the trace, then it is ready to be downloaded into the PLC. In order to do it, we have to select the option Transfer trace configuration to the device.
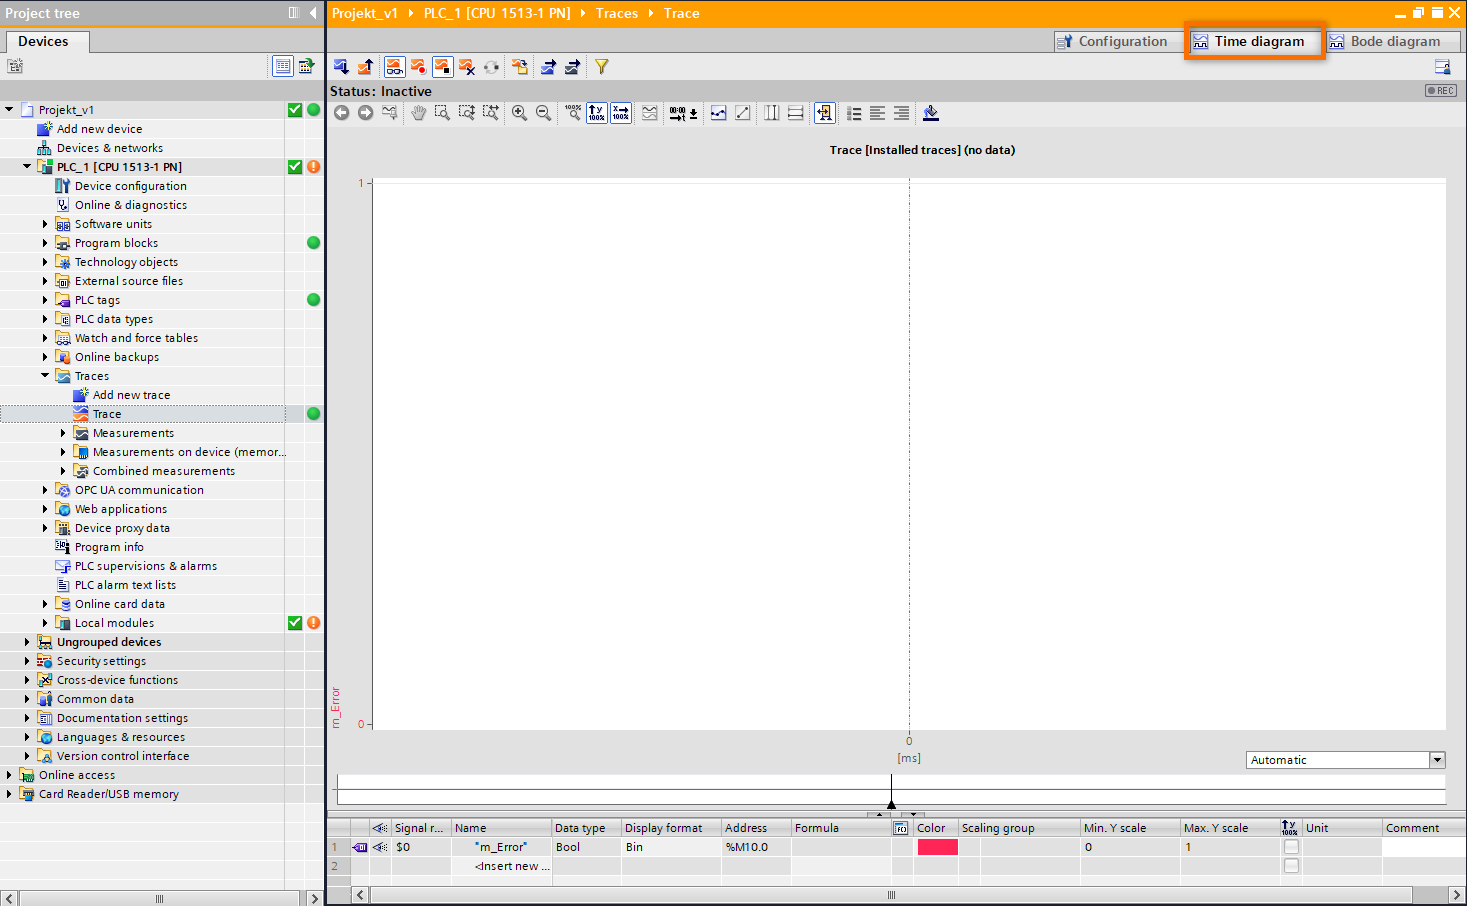
If you are not connected with the PLC yet, then the first connection with the device has to be established. After that is completed, you will be automatically redirected to the Time diagram tab.
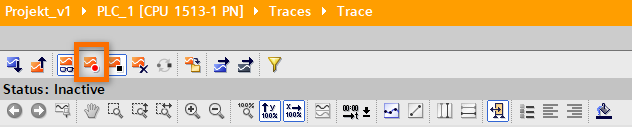
Step 6 – Activating a Trace
In the next step when the configuration is downloaded to the PLC and connection is established, we are ready to activate it.
Depending on the selected configuration, the recording will start immediately or there will be status information: Waiting for Trigger.
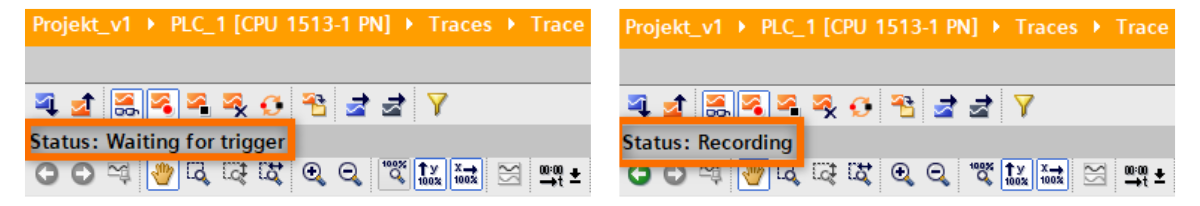
In order to stop the recording manually, the Deactivate button has to be pressed, otherwise, it will continue until the defined max recording time is reached.
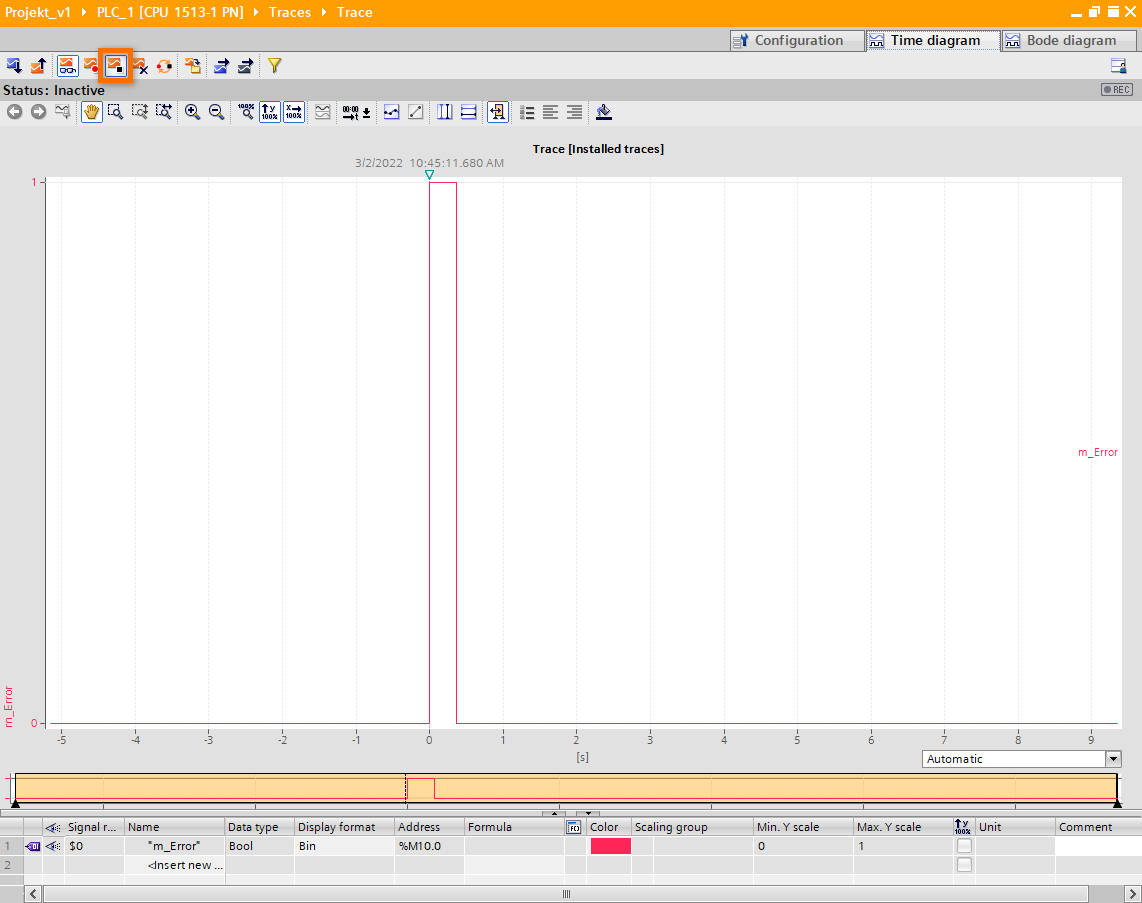
On the attached screen, notice that there are negative values on the time axis. It is due to the defined Trigger on tag option and pre-trigger value.
After recording has been stopped, the trace results will be available until we decide to start it over again, delete it, or there is a power-down of the PLC. When there is a need to create only one trace, the Saving measurement on the device does not have to be configured because the result will be stored automatically. It is possible to view those results only with an online connection to the PLC.
This finishes up the basic introduction to configuring and activating a Trace. In the next step, we will look at the real-life example and how trace helped with diagnosing and solving the issue.
Siemens PLC troubleshooting example
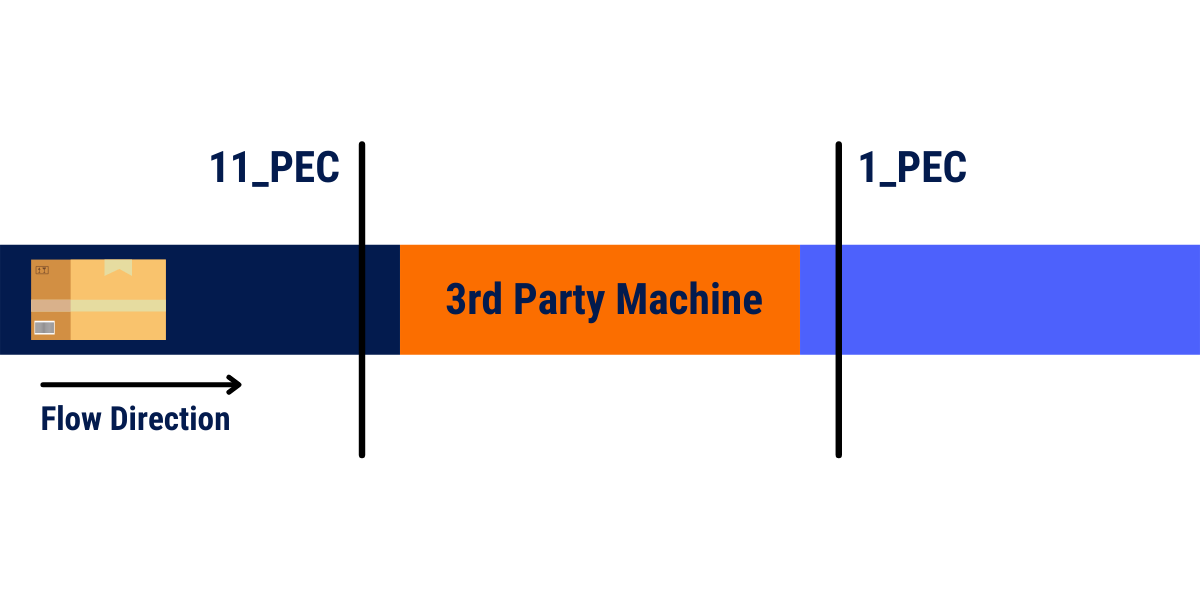
The setup is as follows. There are two conveyors, and in between them, there is a 3rd party machine with which signals are being exchanged. Based on its reported status, the rest of the system is going into energy-saving mode. The primary purpose of this system is to transport packages from the beginning until the end, and the mentioned machine is performing some process that is not relevant in this case.
The issue is that even though the single package had passed through, and the system was empty, it did not go into the energy-saving mode.
I decided to look at the 3rd party machine, as our energy-saving functionality was built based on the information reported by it. I did not have access to the code because an external supplier provided it, and we were only interfacing with it. I have created a trace with three signals, photoelectric cell before the mentioned machine, photoelectric cell after the said machine, and empty bit reported from the machine.
In the next step, I have started the empty system, put one package into the system, and started recording. I did not use Trigger settings and save the measurements on the device because those options were not needed for my troubleshooting. I knew precisely which signals I would like to monitor, and I had to create an event manually by putting a package on the system.
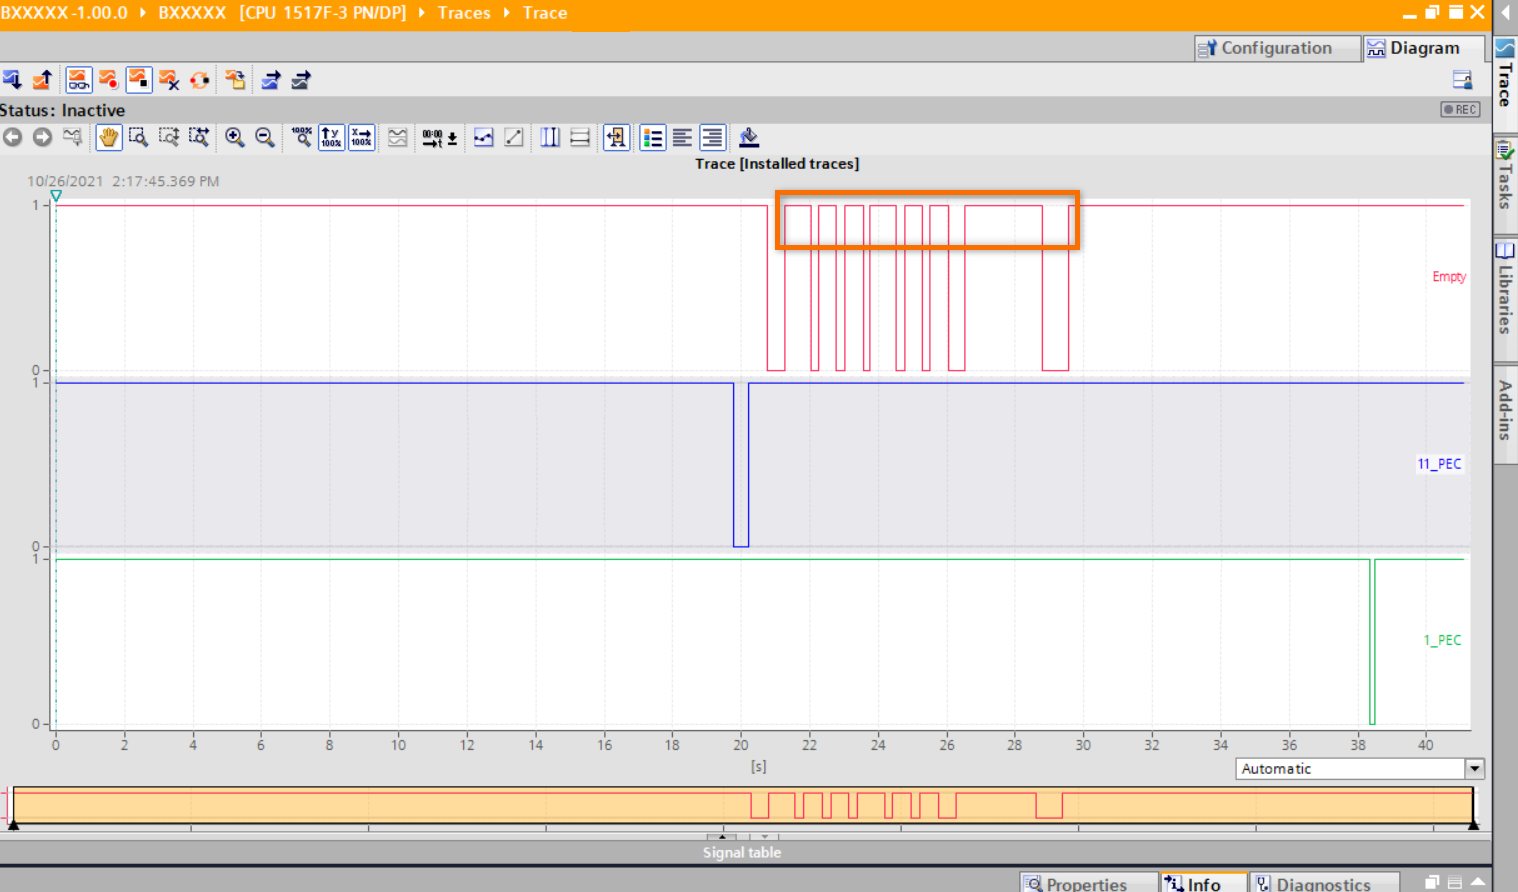
I found out that the 3rd party machine was not reporting empty status correctly. Even though there was still a package on it, it is reported to be empty. I did not have access to the code of this equipment but with the help of a trace tool, I was able to debug it and provide some evidence for the supplier.
Conclusion
Traces are really helpful in diagnosis and debugging. Thanks to it we can track signals which would be very difficult to achieve by only looking at the code. Traces configured together with trigger events can be viewed afterward as we do not have to be connected to the PLC constantly. There is a possibility of recording a defined number of measurements and storing it on the memory card for later use.
In this tutorial, we covered some of the basics of Traces in TIA Portal V17. We have learned how to configure them, and how to activate them. We have seen a real-life example where it was used. I have used this tool many times in my PLC career and I would highly recommend familiarizing yourself with it, as it speeds up the troubleshooting process significantly.
Let’s take a step back and understand why the 5 Whys Root Cause Analysis tools are actually effective in manufacturing. The goal of every manufacturer is to transform raw materials into finished products as cost-effectively as possible. This typically means that they strive to run the equipment as efficiently as possible, invest in maintenance as required, allocate human capital effectively, and ensure that there’s as little waste (quality defects) as possible.
