PLC Troubleshooting Using Trends in Allen Bradley RSLogix/Studio 5000

Introduction
It will happen to every PLC programmer sooner or later: a seemingly inexplicable sequence of events in the code that happens too fast to see. It is a bit like watching a skilled sleight-of-hand magician. You know something is happening, but you have no idea what that something is exactly.
For these kinds of situations - and many more - one of the best tools in your arsenal is the Trend feature. Different manufacturers have their own versions of this, but we will focus on the RSLogix 5000 programming environment in this tutorial.
We’ll start with a basic introduction to Trends, how to set one up, and then go through a real-life example of how a well-configured trend can be the key to troubleshooting.
Prerequisites
For this tutorial, you will need to be Online with an Allen-Bradley Controller via RSLogix5000 or Studio5000. Trends cannot be used while Offline.
Understanding Trends
A Trend is quite simply a graph that traces the value of a numerical tag across time. In RSLogix, only eight tags can be traced at once. And while that may sound like plenty, you'll often find yourself wishing for 10 or 12.
It can be a bit difficult at first to know how to set up a Trend properly for your needs. Indeed, it can be time-consuming. But you will find over and over again that one well-configured Trend capturing the event in question provided the insight needed to find the solution.
Setting up a Trend in Allen Bradley RSLogix/Studio 5000
To set up a trend, there are two main ways.
- The first is to start with a tag that you wish to trace. Simply right-click on it and click on “Trend.”
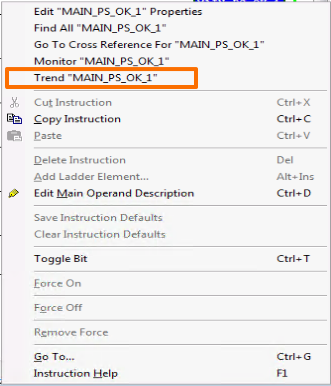
This will open up a Trend window and from there you can add other tags and adjust the configuration as desired.
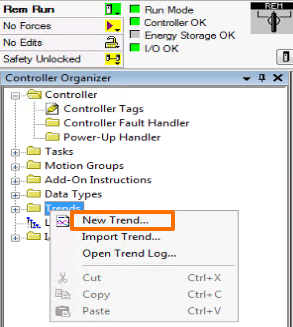
- The second way is to click Trends on the left navigation window, right-click, and select “New Trend…”
Let’s go through the steps of configuring it to work well for troubleshooting.
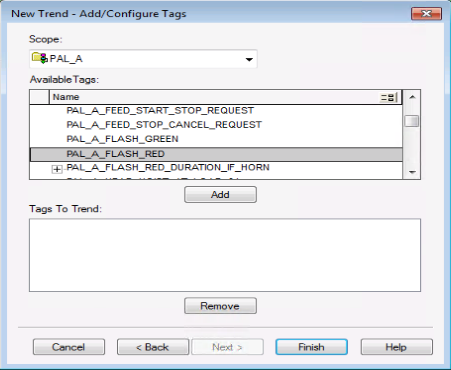
Step 1 - Select the tags you want to Trend.
If you created your Trend using the second method described above, you will have the opportunity to select which tags you wish to trace.
If you created your Trend using the first method, or you find yourself needing to add new tags, you can add them in the “Pens” tab of the Chart Properties (see the next step below for how to open the Chart Properties pop-up).
Step 2 – Configure the settings by opening Chart Properties
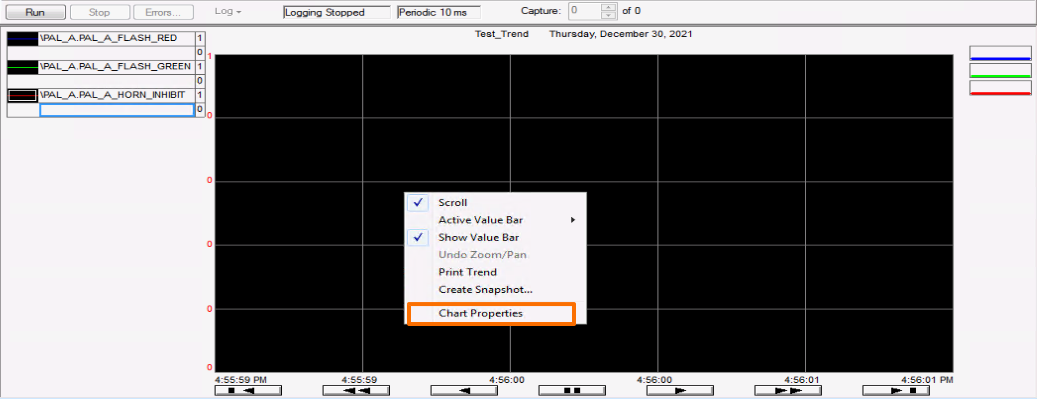
Right-Click anywhere on the Trend window and select “Chart Properties.
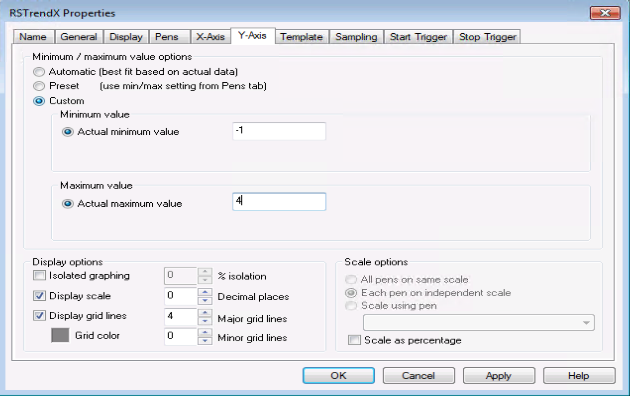
Adjust X and Y axis scales manually. The default Y-Axis scale is not very helpful because it automatically scales to display the signal range as it is traced, filling the entire chart. When trending a BOOL value, you should typically set the Y-Axis manually from -1 to 4 in order to see the signal most clearly. To do this, select “Custom” under the Y-Axis tab of Chart Properties and enter the Minimum and Maximum values.
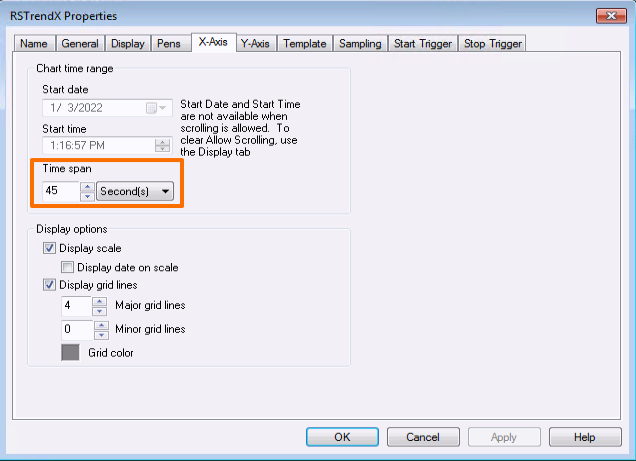
The default X-Axis sample time is too short to be useful. Depending on the context, I recommend setting it between 15 seconds and 2 minutes. You can always zoom in to a specific area, as we will see in the real-life example below. To do this, select the X-Axis tab of the Chart Properties window and set the Time Span to the desired amount.
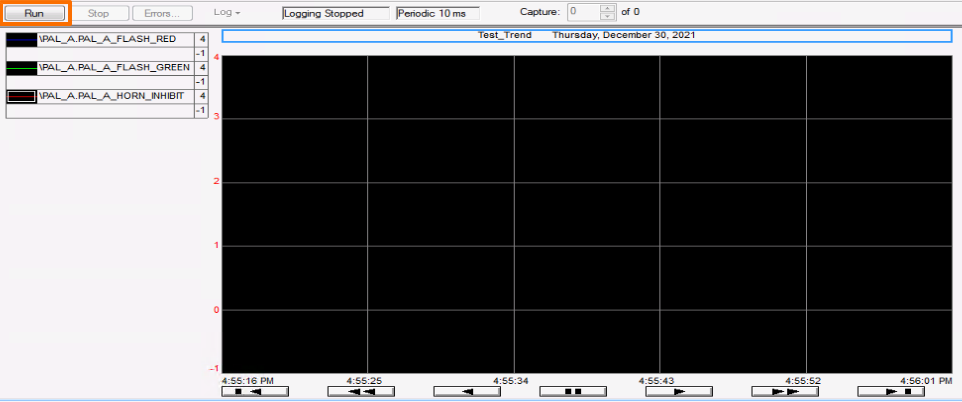
Step 3 – Press RUN and start trending some data
This concludes the basic introduction to setting up a Trend. Next, we will take a real-life troubleshooting example and see how using a Trend helped solve the issue. And along the way we will cover some more advanced configuration settings and features that are helpful.
PLC Troubleshooting Example
Here is the setup: We have a motorized axis (a pusher bar) that does a repetitive circular motion such that at the end of each cycle the bar returns back to its home position, which is detected by a photo-eye. When the reflector on the bar hits the beam of the photo-eye, the bar is supposed to continue running for 500ms and then stop. This will stop it exactly where it should be. But we noticed that it was stopping instantly instead of running on for 500ms, and this was leading to some faults and production stoppages. The logic for this axis is complex because it has gone through multiple programmers, upgrades, iterations, and by the end, it was very hard to know which of the five or six conditions was causing this problem.
After reviewing the logic for some minutes and not getting anywhere, I decided to set up a trend to trace the movement and conditions of the pusher bar. By trending all the possible signals, I felt confident I would see something in the trend that would explain the issue. In this case I had one INT tag that serves as a kind of encoder for the pusher bar (it is a proximity sensor counting how many teeth on the drive sprocket go by).
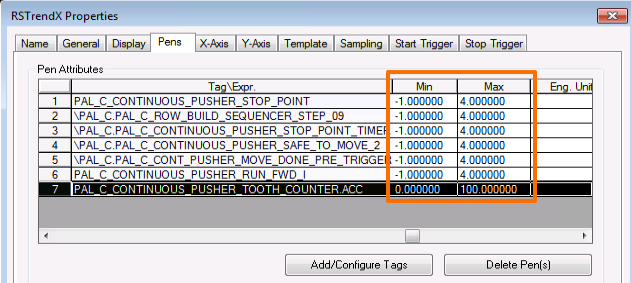
But this meant that my Y-Axis scaling would need to be set up differently in order to see both the INT tag with values from 0 to 80 and the BOOL tags going from 0 to 1. This is where it is useful to have different Y-Axis scalings for different tags. This can be set up under the Pens tab:
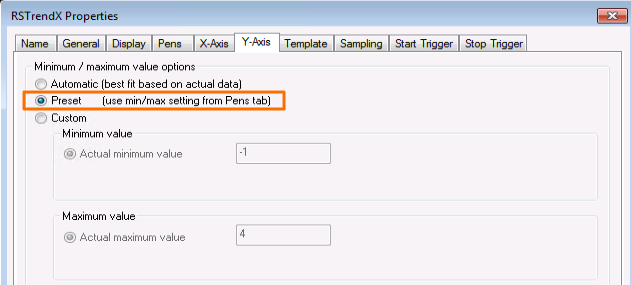
Once the Min & Max values are setup as desired, select “Preset” for the Minimum / Maximum Value Option under the Y-Axis tab:
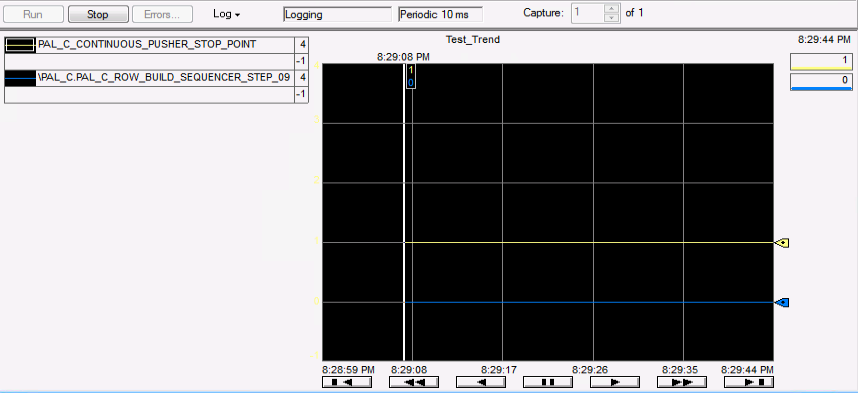
With the trend all set up, I clicked RUN and let it capture a few cycles of movement. Then I pressed STOP on the Trend in order to zoom in and analyze the findings.
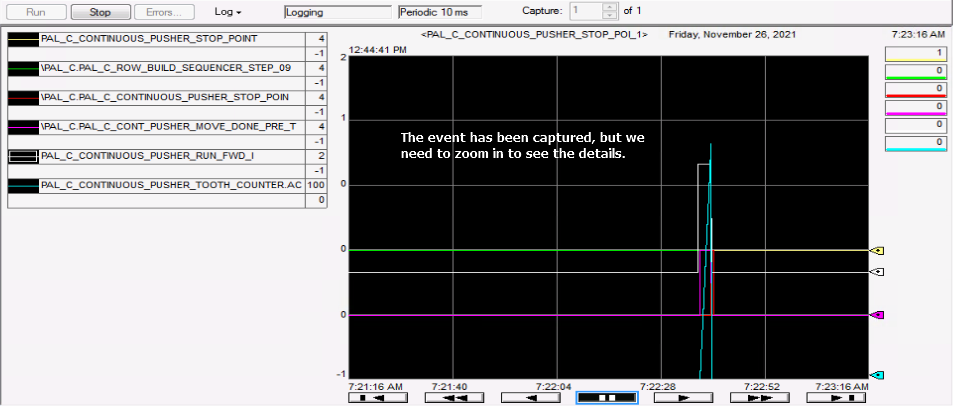
The event was short compared to the length of my X-Axis, so clicking and dragging a rectangle around the trend lines of the event, I was able to zoom in:
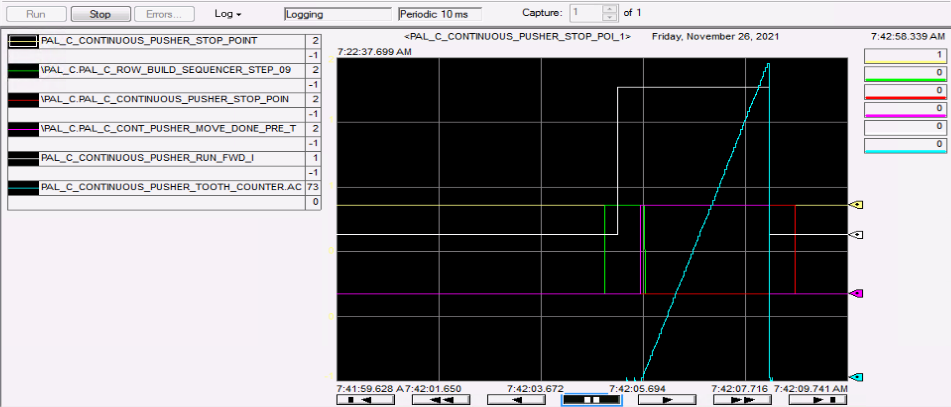
With this view, we can see the event much clearer. Our issue is with the end of the event, so we will zoom in one more time, and then by clicking the cursor at various points along the X-Axis, we can see the instantaneous status of each signal:
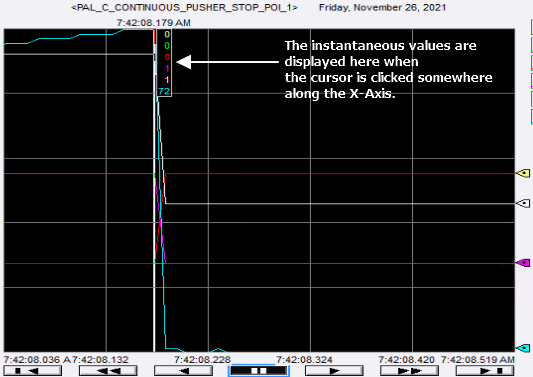
it became clear that one of the conditions was dropping partway through the cycle, meaning that the timer was never started. This explained the behavior we had observed.
A quick modification of the code, and the problem was solved. This saved what could have been a long and involved investigation into a motorized axis that, despite the code not being the cleanest or easiest to work with, still works dependably.
Conclusion
Trends are incredibly powerful troubleshooting tools. They can capture issues with the PLC code that happens too quickly for the eye to see. Knowing how and when to deploy them can seriously level up your troubleshooting abilities.
Also, in production-oriented environments, re-writing messy code is not usually a viable option because of the time required and the risk of downtime. Therefore a more surgical approach to troubleshooting existing code, even when that code is messy and confusing, is much to be preferred. A well-configured trend can be just the thing to pinpoint the exact source of the problem.
In this tutorial, we covered some of the basics of Trends in RSLogix 5000. We learned how to set them up, some tips, and went through an example of a real troubleshooting situation in which it made all the difference. In your journey as a PLC programmer, this is one tool you will definitely want in your belt.
