Siemens PLC Troubleshooting Using Watch Tables in TIA Portal V17

Introduction
We frequently have to examine the state of certain PLC tags during commissioning activities or to detect a problem. If this variable is utilized multiple times and the sequence of block calls is not clear to us, it may be difficult to follow the program.
The watch tables tool is included in TIA Portal V17 to assist you in these circumstances. It's a table that shows the current value of the signal you have chosen. It is easy to set up and will assist you with testing and troubleshooting.
In this tutorial, we will look at how to use the Watch Table in TIA Portal V17. We will start by discussing what a watch table is, how to set up and work with one, and finally, we will go over a practical field example.
Prerequisites
To follow along with this tutorial, you will need to be online and connected to a Siemens PLC via TIA Portal V17. Note that it is possible to use a watch table with S7-PLCSIM Advanced V4.0.
Understanding Watch Tables in Siemens TIA Portal V17
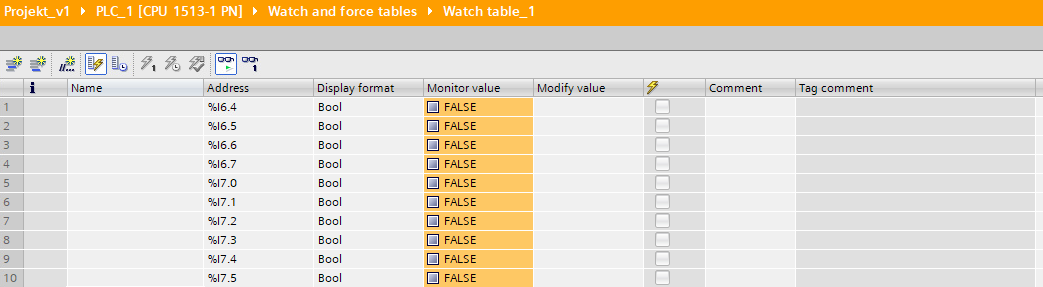
A watch table is a table that displays the current value of a signal. The number of watch tables you can create is unlimited. All of the tags defined in the PLC can be recorded in the watch table. When performing I/O check operations, it comes in handy. As an example, when we have wired a new circuit breaker to the system, it has to be confirmed that the correct input has been used based on the electrical drawings. Using a Watch Table simplifies the process.
Creating a Watch table in Siemens Tia Portal
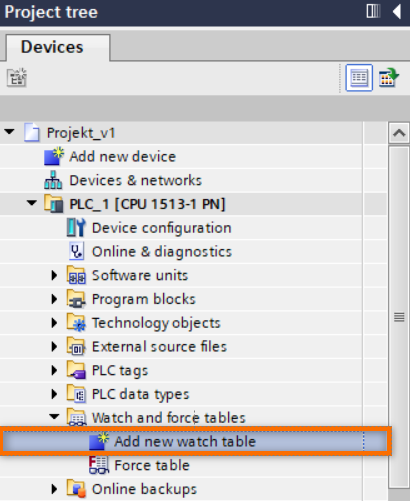
In order to create a new watch table, we must first create a configuration by going to the Project Tree and selecting the Add new watch table option. This will bring up a window for configuring the newly created Watch table.
Step 1 – Define your Signals
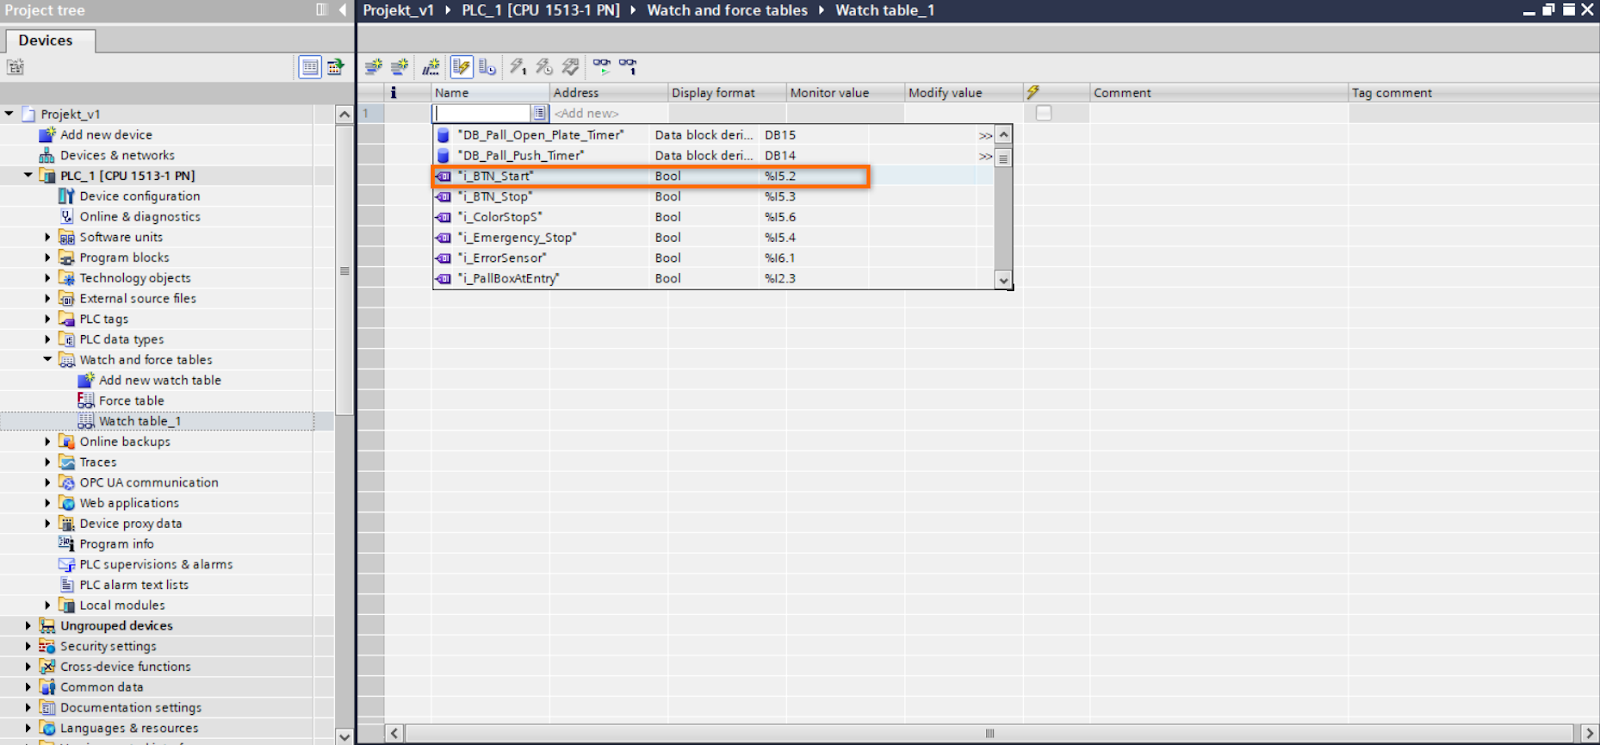
Selecting your signals is the first step in setting up your Watch table. Signals are considered to be variables that are defined in the PLC tag tables. It is possible to refer to the variables in the Data Blocks and the Data Instances of the functions as well, as long as those variables are of an elementary data type. In the configuration window, we can select the signals that we want to monitor.
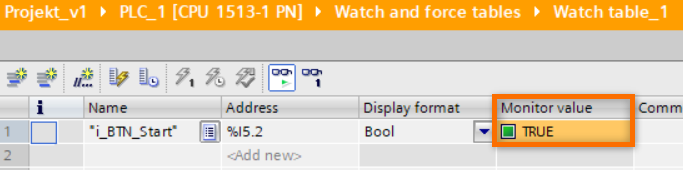
Step 2 – Monitoring a watch table
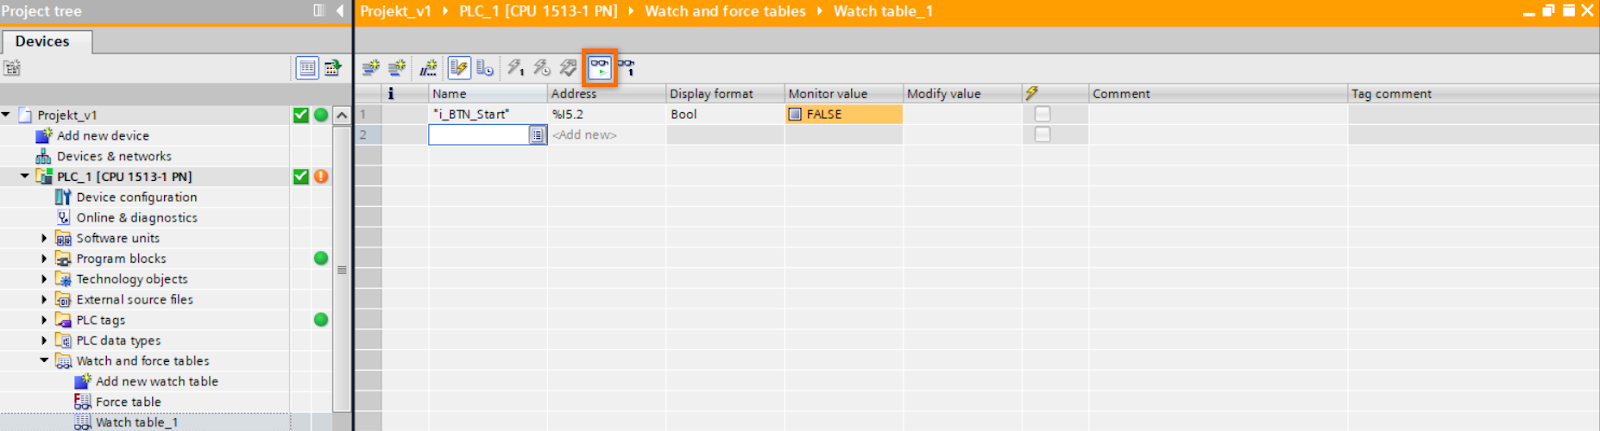
If you have not done so already, you will need to connect to the PLC first. After that, you will be automatically moved to your newly made Watch table.
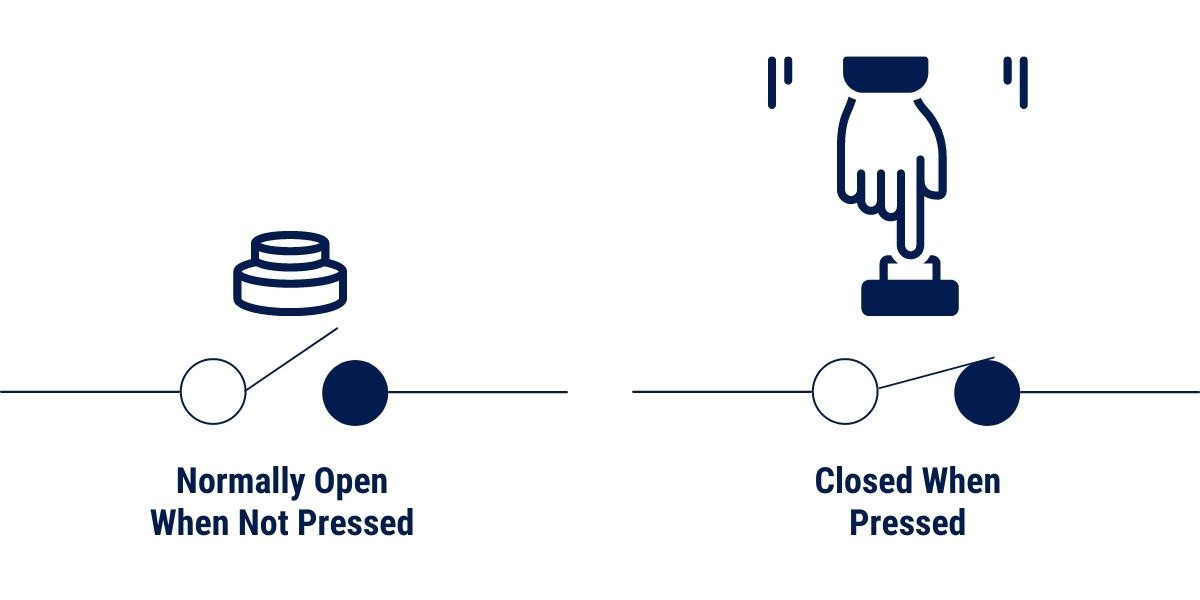
The actual value of the selected tag is displayed in the Monitor value column. The monitored value in this example is related to a physical input that comes from a start button, which is wired as a normally open contact type. Whenever the button is pressed and held, the value is going to be TRUE.
Step 3 – Modify tag value
In the watch table, you can change the value of the tag. To do so, we must first display the modified column, define the value we want to modify, tick the lightning box to select variables, and then click Modify All Selected Values at Once. It is important to note that all of the specified values will be changed at the same time.
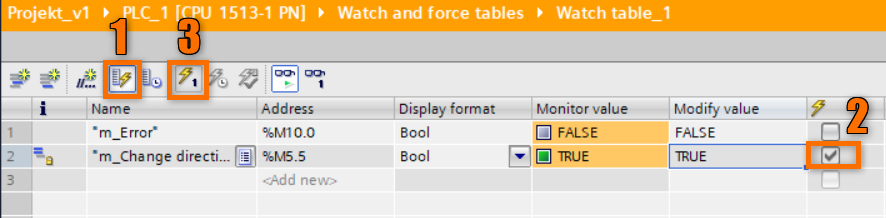
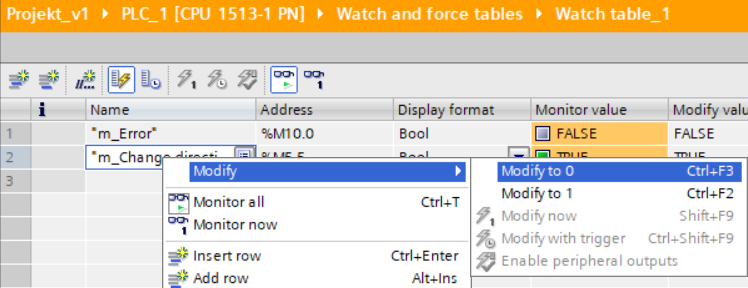
It is possible to modify only one tag, by right-clicking on the selected signal and selecting the options Modify -> Modify to 0/1.
This tag can only be changed through the watch table if it is not written in the program and is not a physical input.
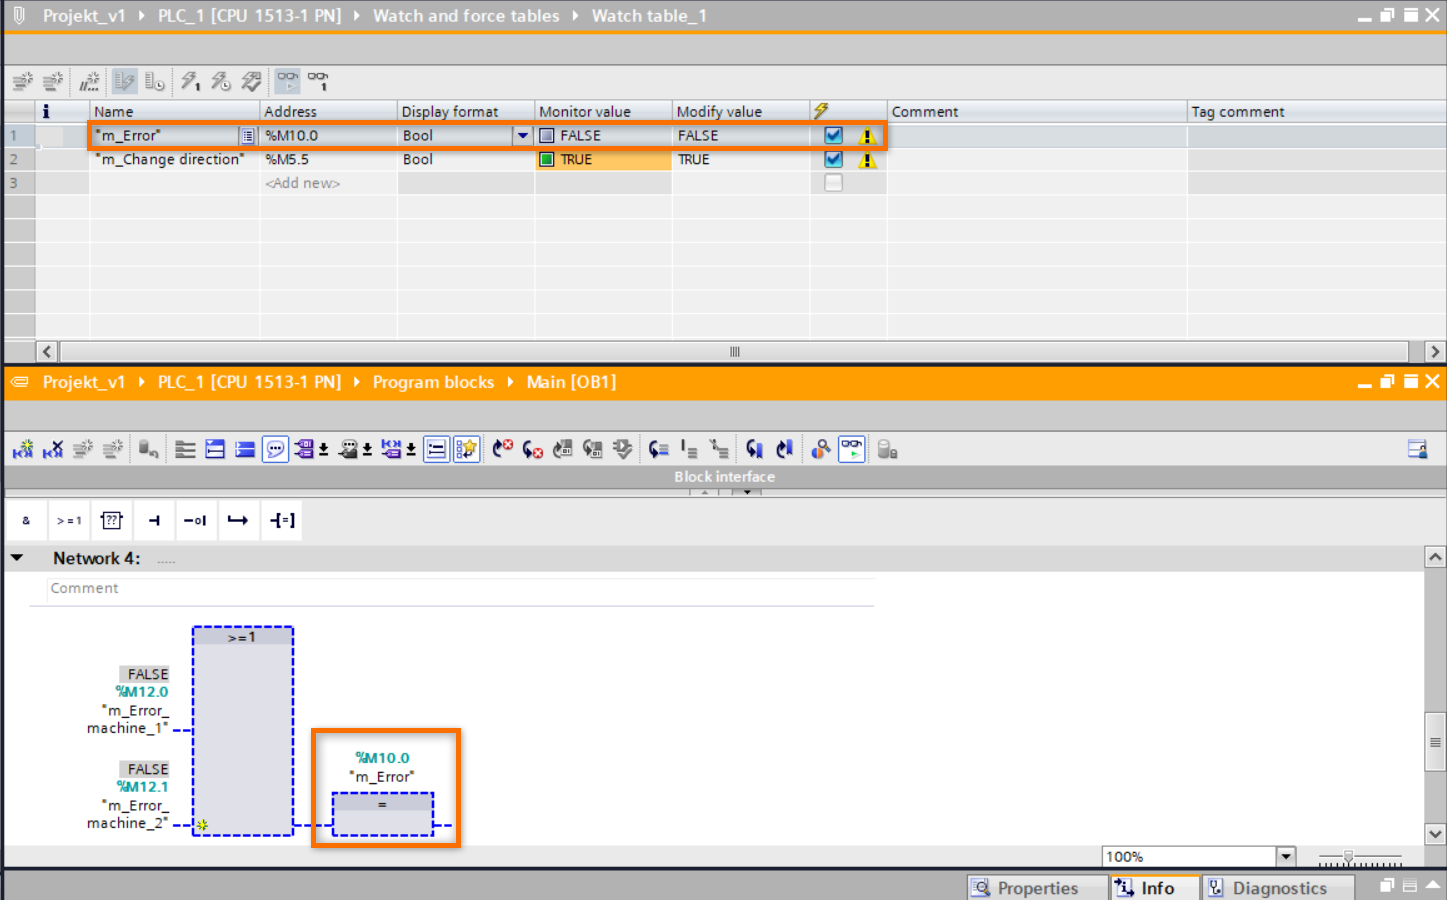
In the presented case, there is no possibility of modifying “m_Error” from the watch table.
It is possible to monitor memory bits, inputs, and outputs without the existing tag. It's a useful feature in situations when, for example, we know we have a new input connection on a specific hardware card, but we do not know which input address it is. By activating it and monitoring it on the watch table, we can figure out where it is connected.
There is no need to download the watch table to the PLC. It only exists in the project.
Step 4 – Import tag table
There is an easy way to copy a list of signals into the actual watch table if we have one in excel.
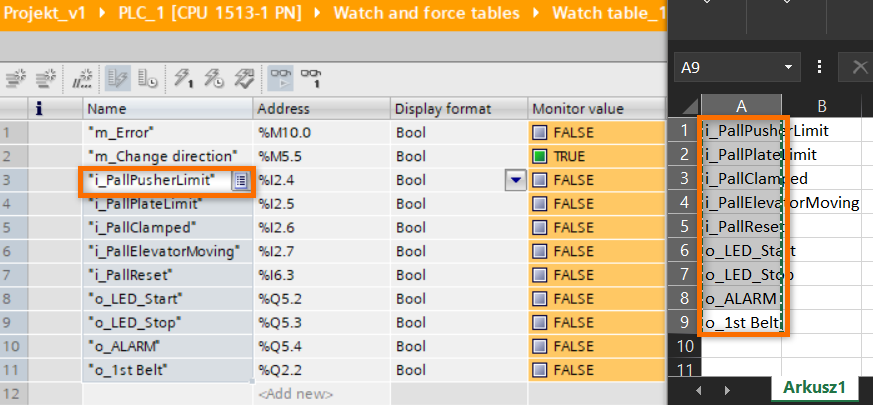
We can select the whole list in excel, copy it, select one cell in the watch table and paste it. If a tag with the copied names already exists, the addresses will be auto-filled.
PLC Input check example
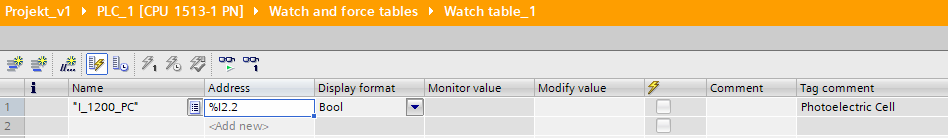
Let's assume we have been given the responsibility of verifying that the photoelectric cell signal is being sent to the correct input because the systems have undergone some electrical changes, and we have been asked to double-check. In the first step, we must determine the actual location of the sensor and identify where it should be connected to the PLC using the electrical schematics.
.jpeg)
It is preferable to comment out relevant parts of the program before running tests to perform an IO check. It is important to mention that those actions are intrusive on the system and it is advised to perform them while the system is not running. The next step is to create a VAT table and add input as per drawing I2.2.
This photoelectric cell is retroreflective which means it requires a reflector and can be set up in either light or dark mode, depending on the configuration.
- Light mode - when a light beam is returned to the receiver, a light switching sensor turns its output ON. A light mode setting could be utilized if a normally closed-type contact operation is required.
- Dark mode - when the light beam is blocked from returning to the receiver, a dark switching sensor turns its output ON. A dark mode setting could be utilized if a normally open-type contact operation is required.
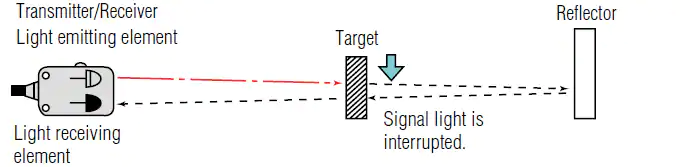
The specified photoelectric cell is configured in the light mode in the present scenario. As functionality has been determined, we can proceed to check the input. We expect the input to be TRUE when there is nothing in the way of the sensor and the reflector. If this is not the case, and we have confirmed that the mode setting is correct, another thing to look for is mechanical alignment between the photoelectric cell and the reflector. It should be aligned so that the light beam is directed straight to the reflector and then back to the photoelectric cell.
There are two states that must be tested:
- Idle state - value TRUE, photoelectric cell light beam is not interrupted
- Activated state - value FALSE, photoelectric cell light beam is interrupted
By covering the photoelectric cell's light beam with your hand, you can see if it is functioning correctly. When a photoelectric cell is covered, the value should change from TRUE to FALSE. When it is not covered anymore, the value should change from FALSE to TRUE.
.jpeg)
We verified the photoelectric cell's functionality after completing those steps, and it functioned as intended. We have learned the difference between the configuration modes for retroreflective photoelectric cell and how they work. The watch table made it possible to view the actual value of the signal coming from the photoelectric cell.
Conclusion
Watch tables are really helpful in diagnosis, debugging, and commissioning. It's a simple tool that displays the current value of the signals in the form of a table.
In this tutorial, we covered some of the basics of Watch tables in TIA Portal V17. We have learned how to configure them, and how to use them. We have seen a real-life example where it was used. I have used this tool frequently in my PLC career, and I highly recommend familiarizing yourself with it because it considerably speeds up the debugging and commissioning process.
