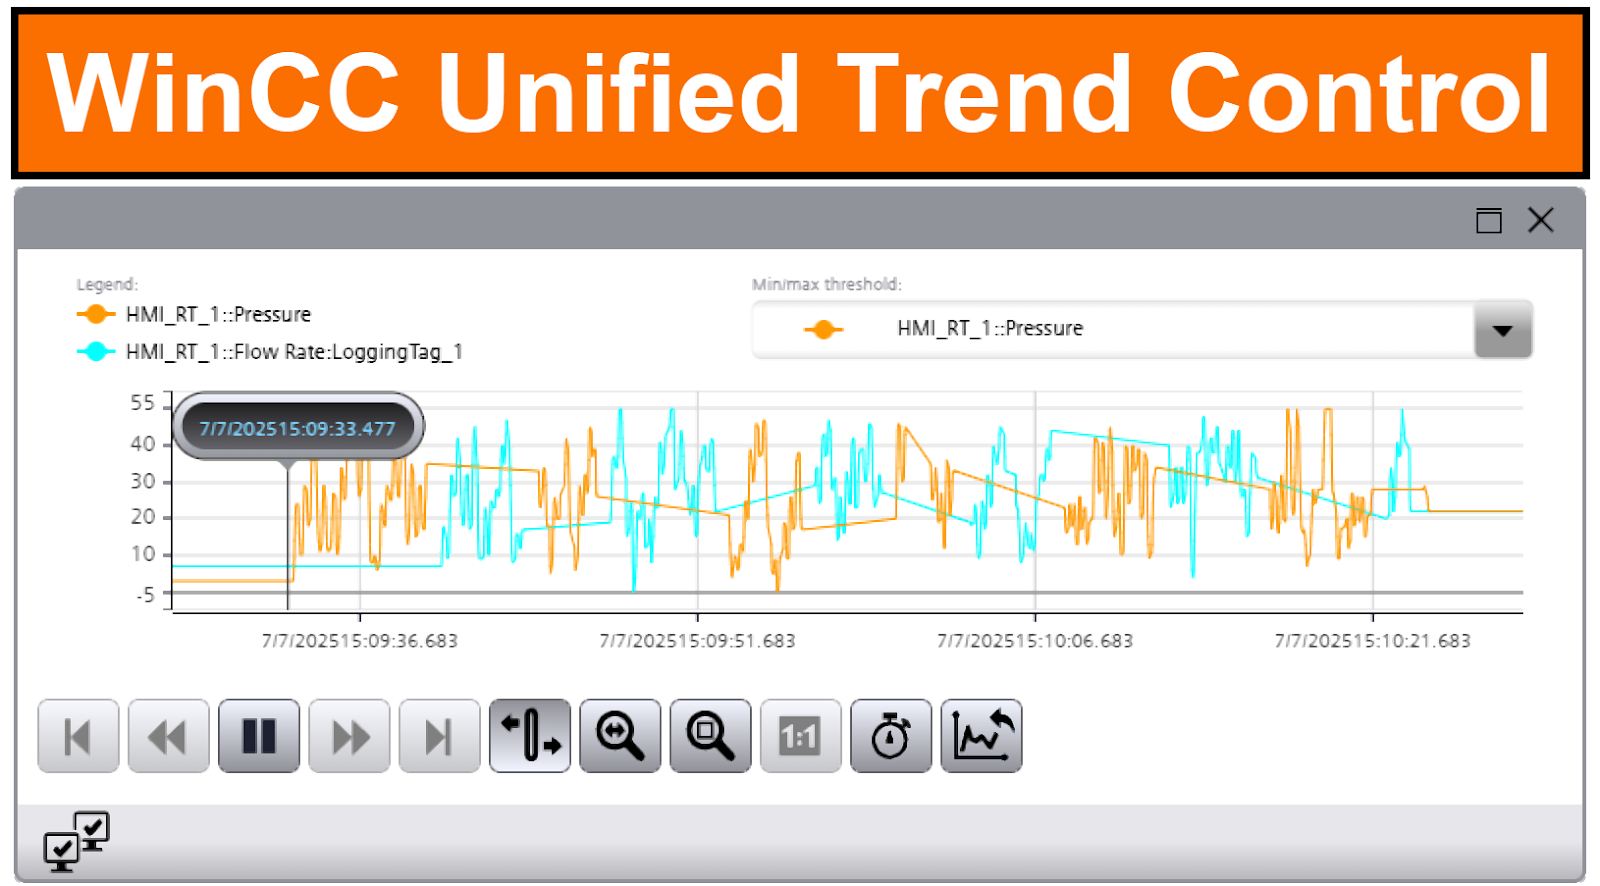
Introduction to WinCC Unified Trend Control

Introduction
If you're working in industrial automation and you don't know your way around WinCC Unified Trend Control, you're making life harder for yourself. This skill isn't optional anymore. Visualizing real-time data and digging through historical logs is the bread and butter of modern plant operations. You should keep an eye on all vital process parameters so you can catch problems before they blow up. Everything's about data-driven decisions now. This tutorial walks you through practical steps in TIA Portal. Whether you're designing, integrating, or just fixing stuff, mastering these trend tools will make your projects more transparent and less painful to troubleshoot.
Prerequisites
Before diving into this tutorial, make sure a few things are in place. Ensure you have the TIA Portal software installed on your system. While the tutorial was created using version 19, any version from 16 onward will work without issues. You will engage more with this tutorial if you're already comfortable with key topics like "Introduction to WinCC Unified", "Downloading Projects Securely", and "Screen Object Dynamization".
Getting Started with Trend Control
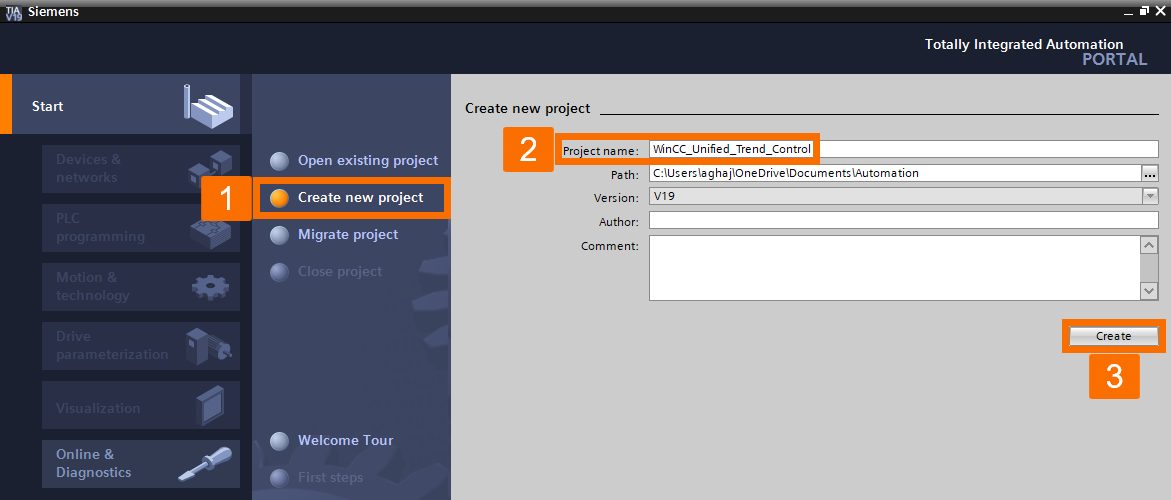
Open the TIA Portal Software on your personal computer and start creating a new project called "WinCC_Unified_Trend_Control".
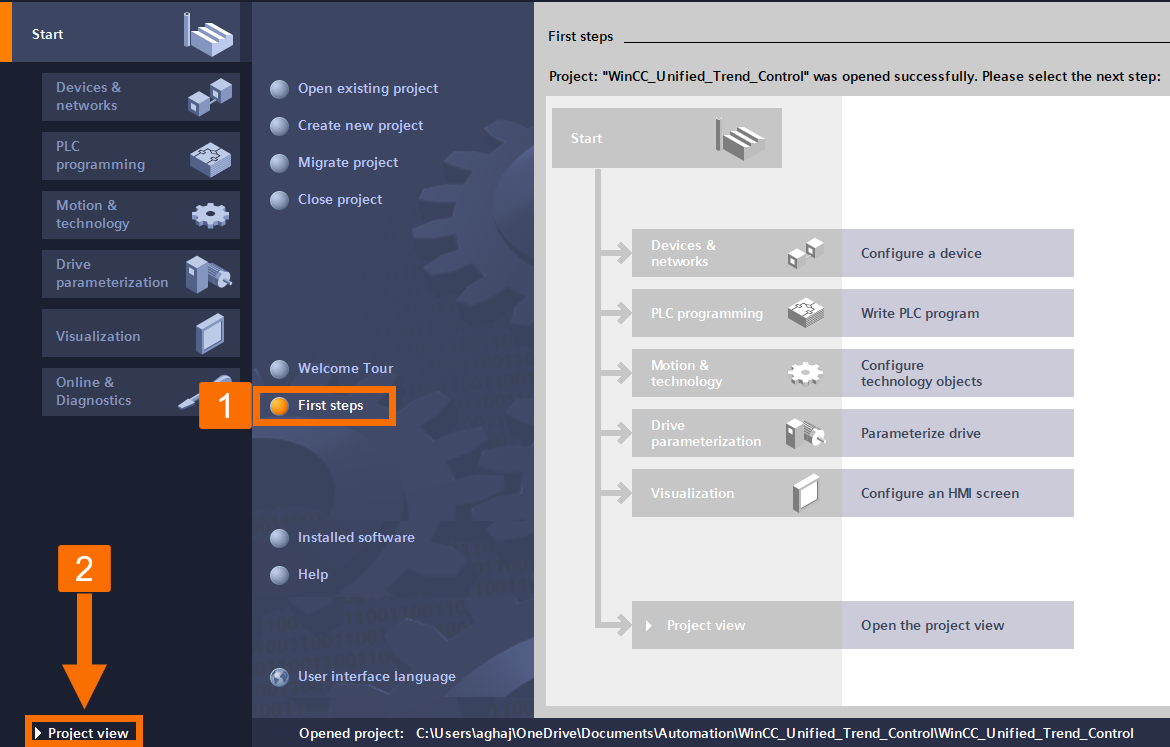
Once the "First Steps" window opens, switch to the "Project View".
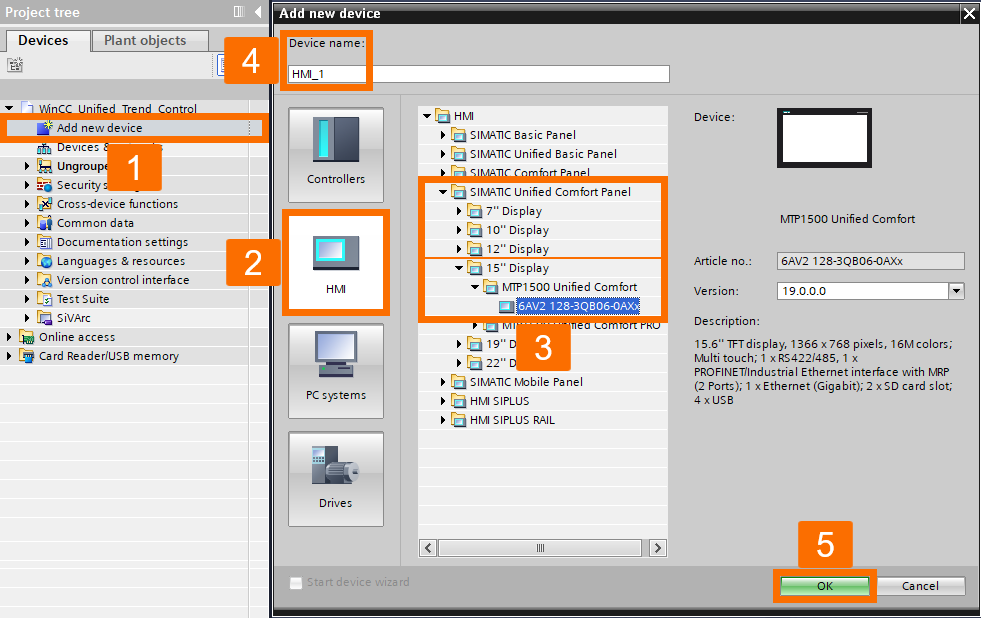
Double-click "Add New Device" in the project tree on the left pane, and once its window opens, click on the "HMI" tab. Navigate through the "SIMATIC Unified Comfort Panel" folder to find and select the "MTP1500 Unified Comfort". Give your panel a desired name and press the "OK" button.
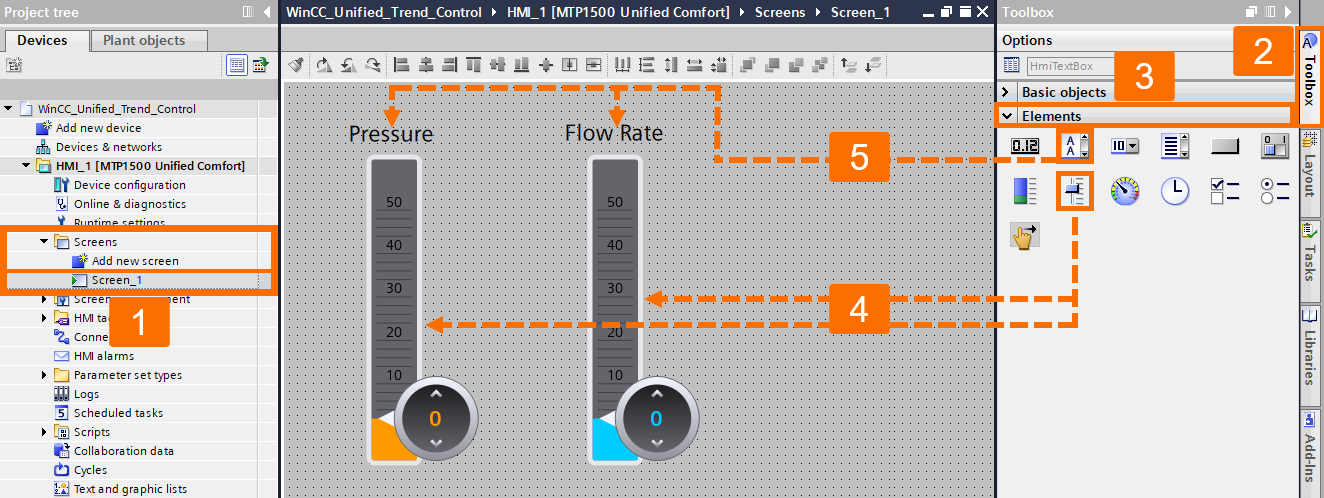
Once the HMI is added to the project tree, expand the "Screen" folder and double-click "Add New Screen" to start designing your panel. Expand the "Elements" section under the "Toolbox" task card on the right pane and drag and drop two sliders and two text boxes as illustrated in "Figure 2.4."
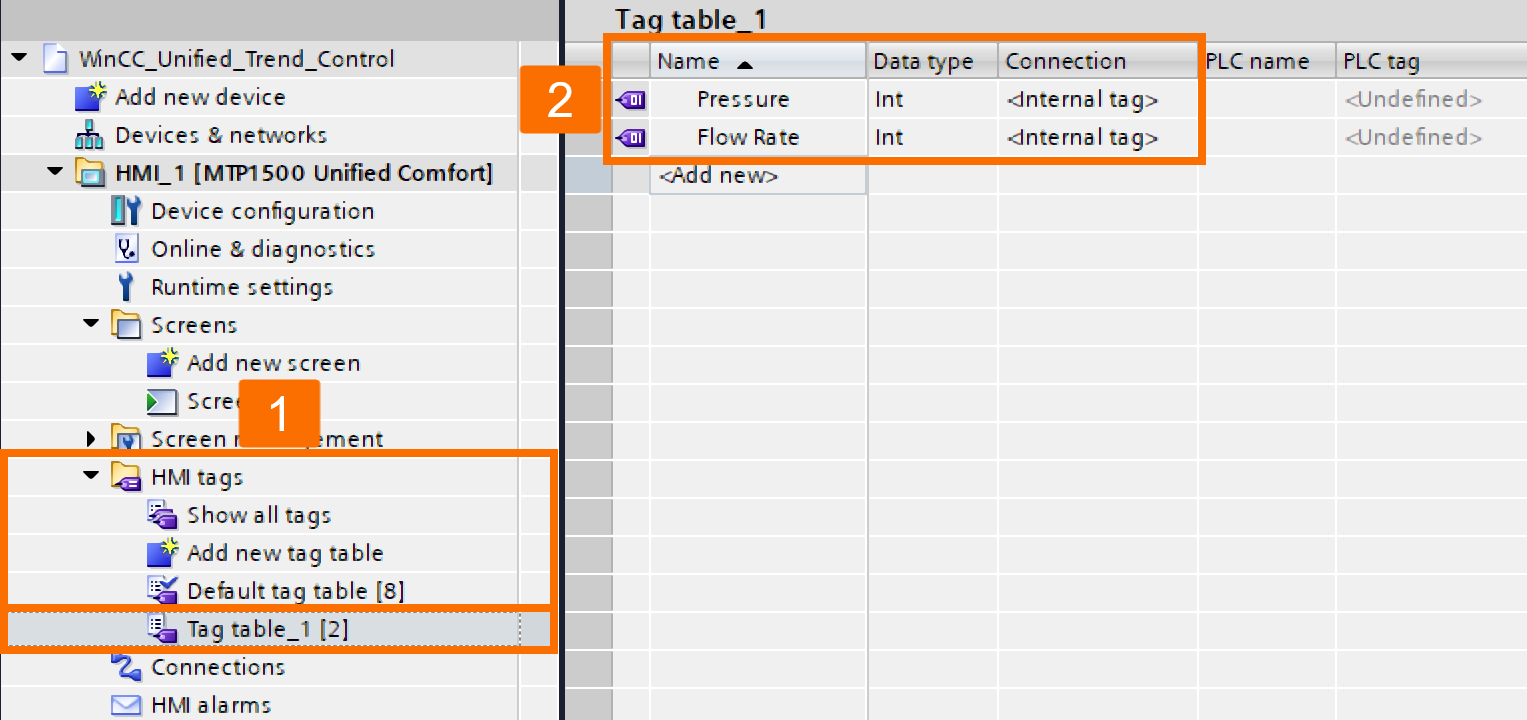
Now, expand the "HMI Tags" folder in the project tree and double-click "Add new tag table." Once this tag table is created, define two internal HMI tags called "Pressure" and "Flow Rate", each with the "Integer" data type.
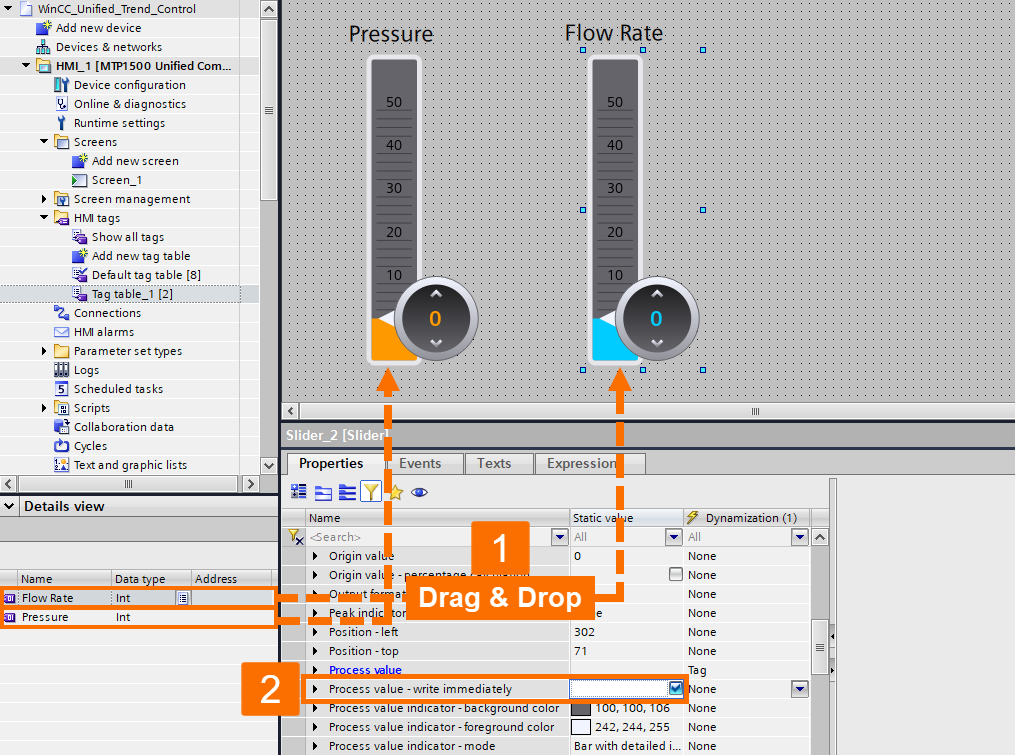
For each slider, assign its relevant tag (e.g., a speed tag to the speed slider and a flow rate tag to the flow rate slider) and enable the "Write Process Value Immediately" option.
Expand the "Controls" section under the "Toolbox" task card and drag and drop the "Trend Control" item to the screen. Next, change the sorting in the list of object properties by category and then navigate through the "General" section to find trend areas.
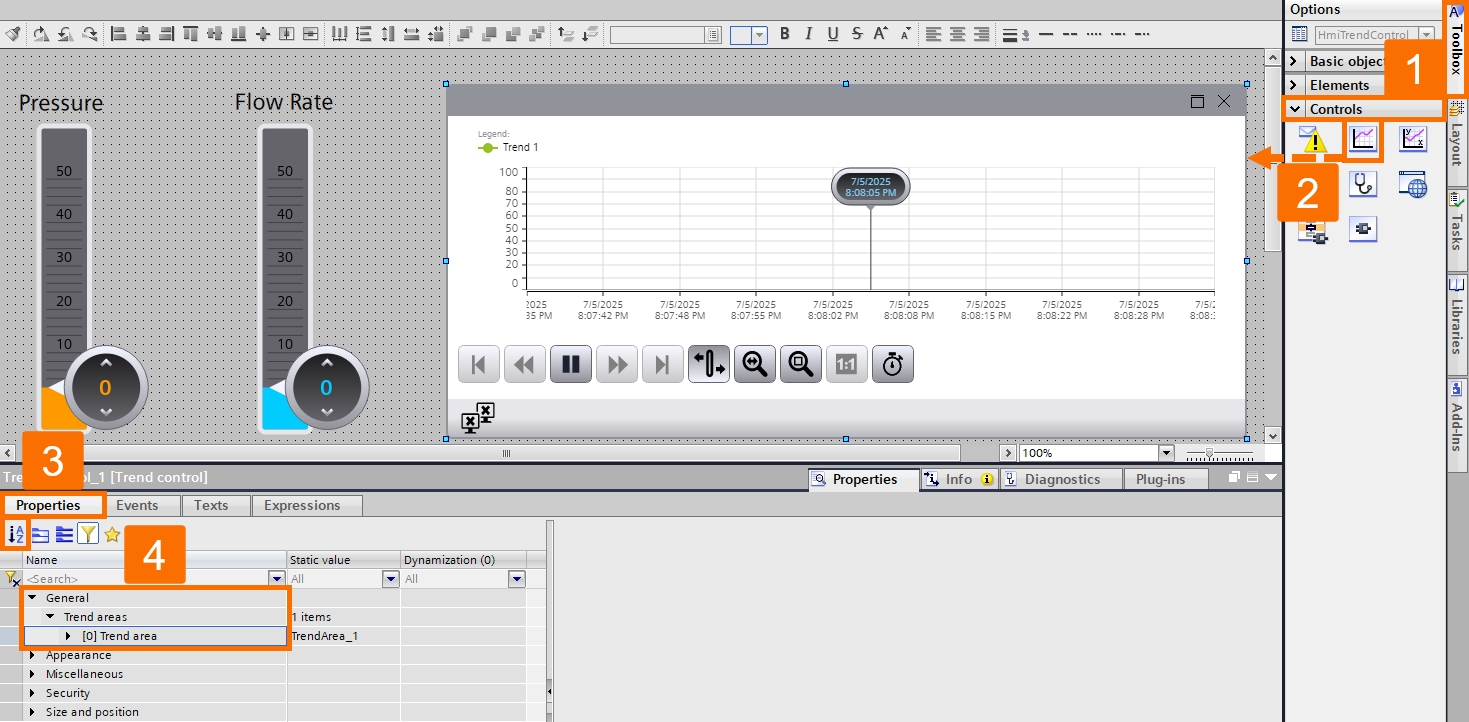
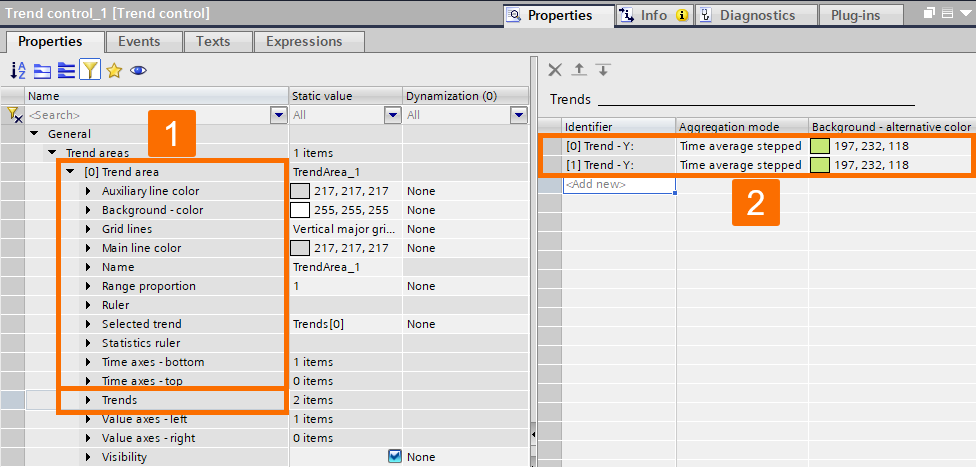
Expand the "[0] Trend Area" to find the "Trends" item. Here, double-click "<Add New>" to add another identifier to the list since you have defined two tags.
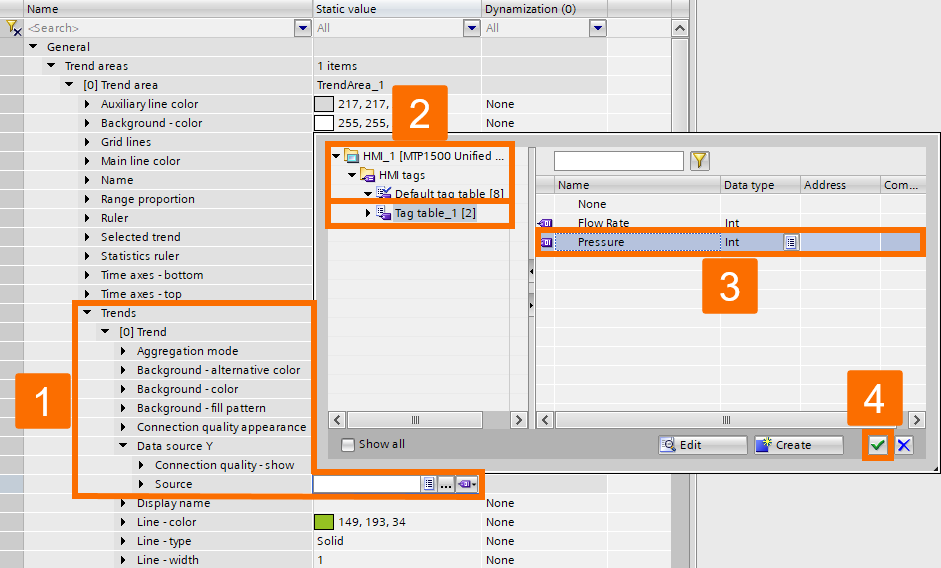
Navigate through the "Trends" item to find and expand the "Data Source Y" of the "[0] Trend" and connect its "Source" to the "Pressure" tag.
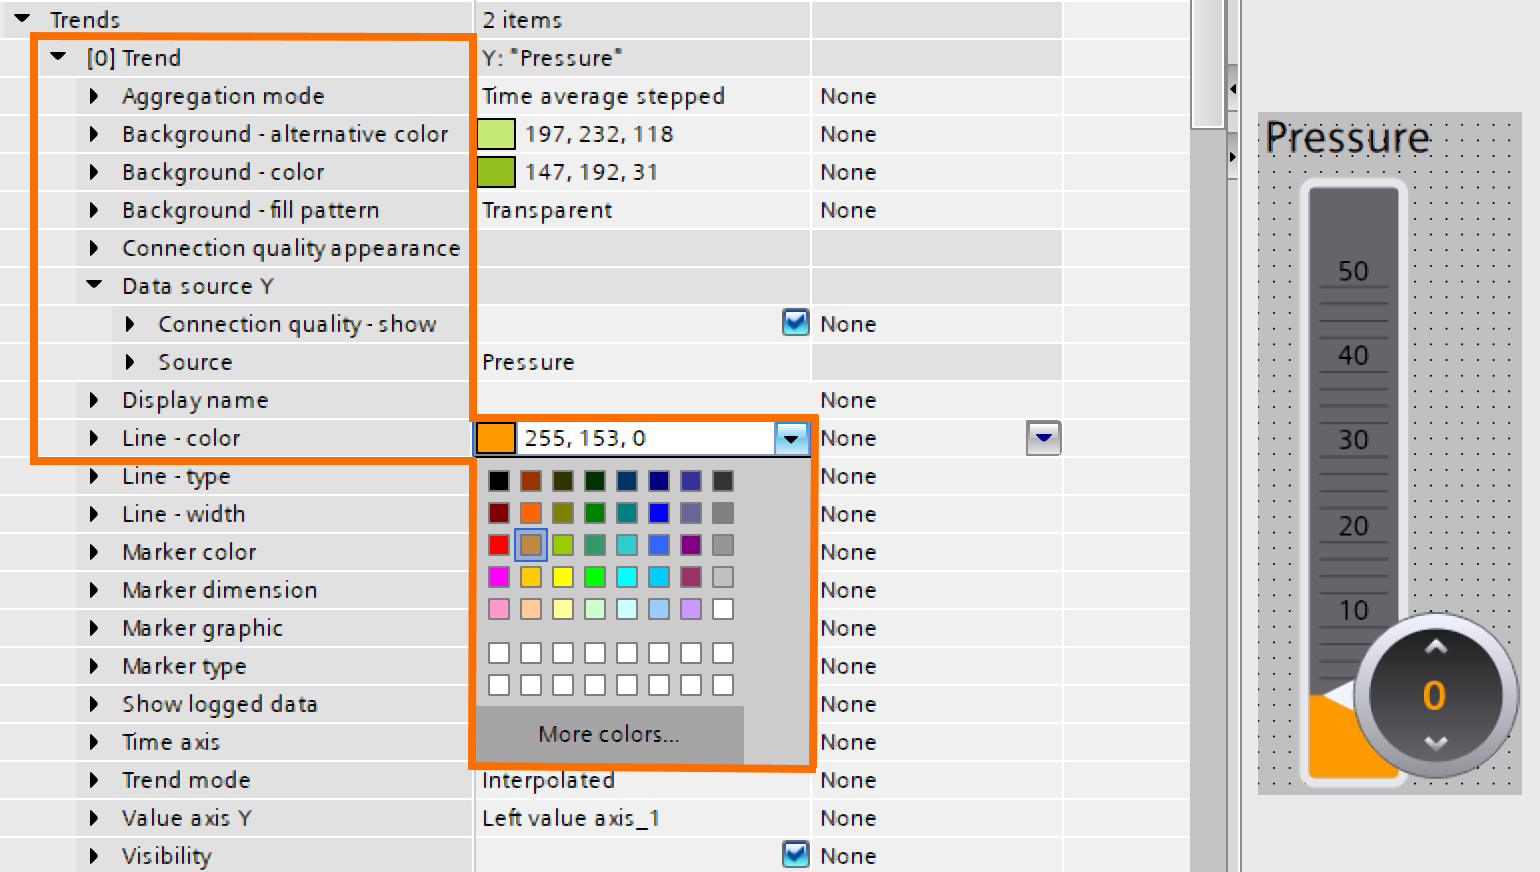
The line color of the first identifier should be the same as the color of the "Pressure" slider.
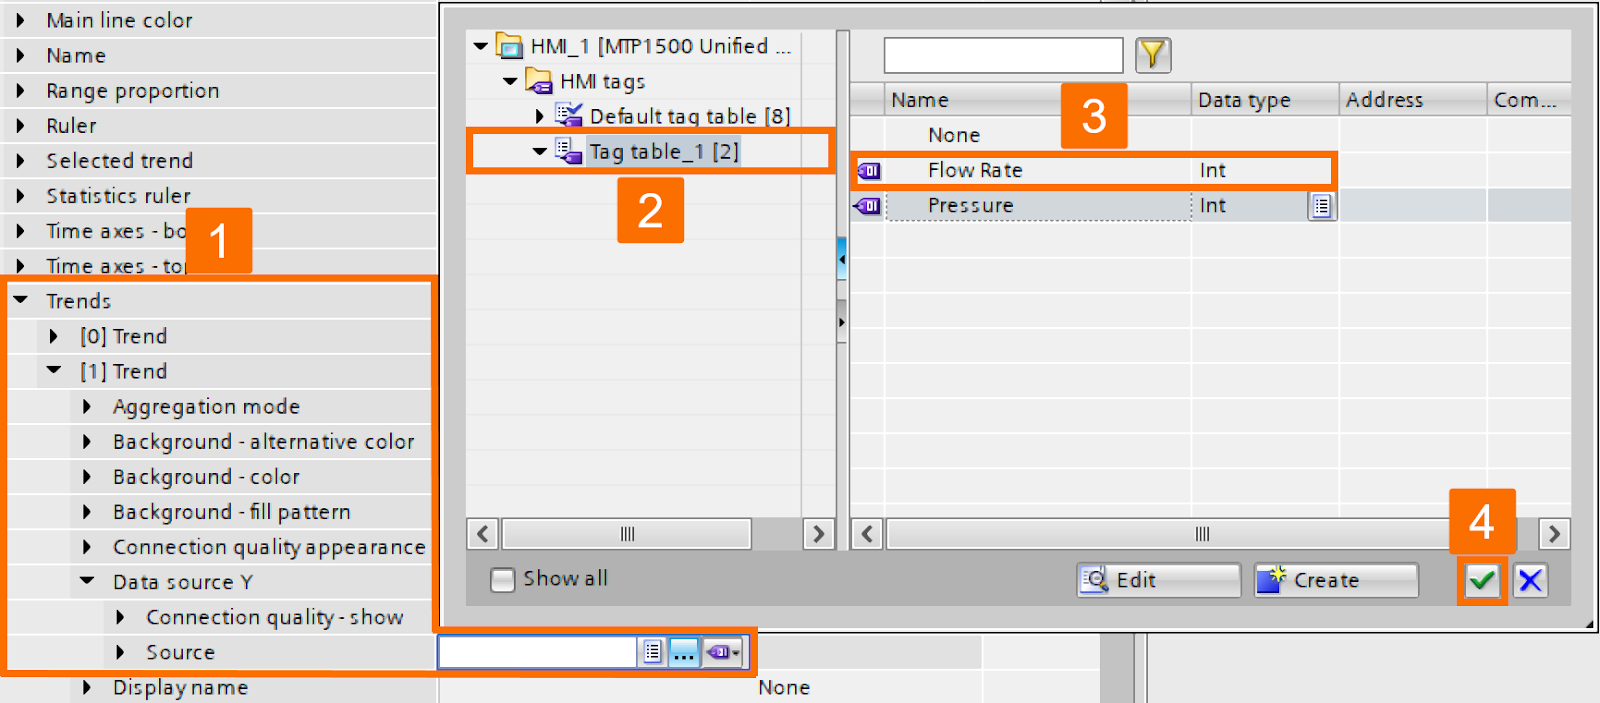
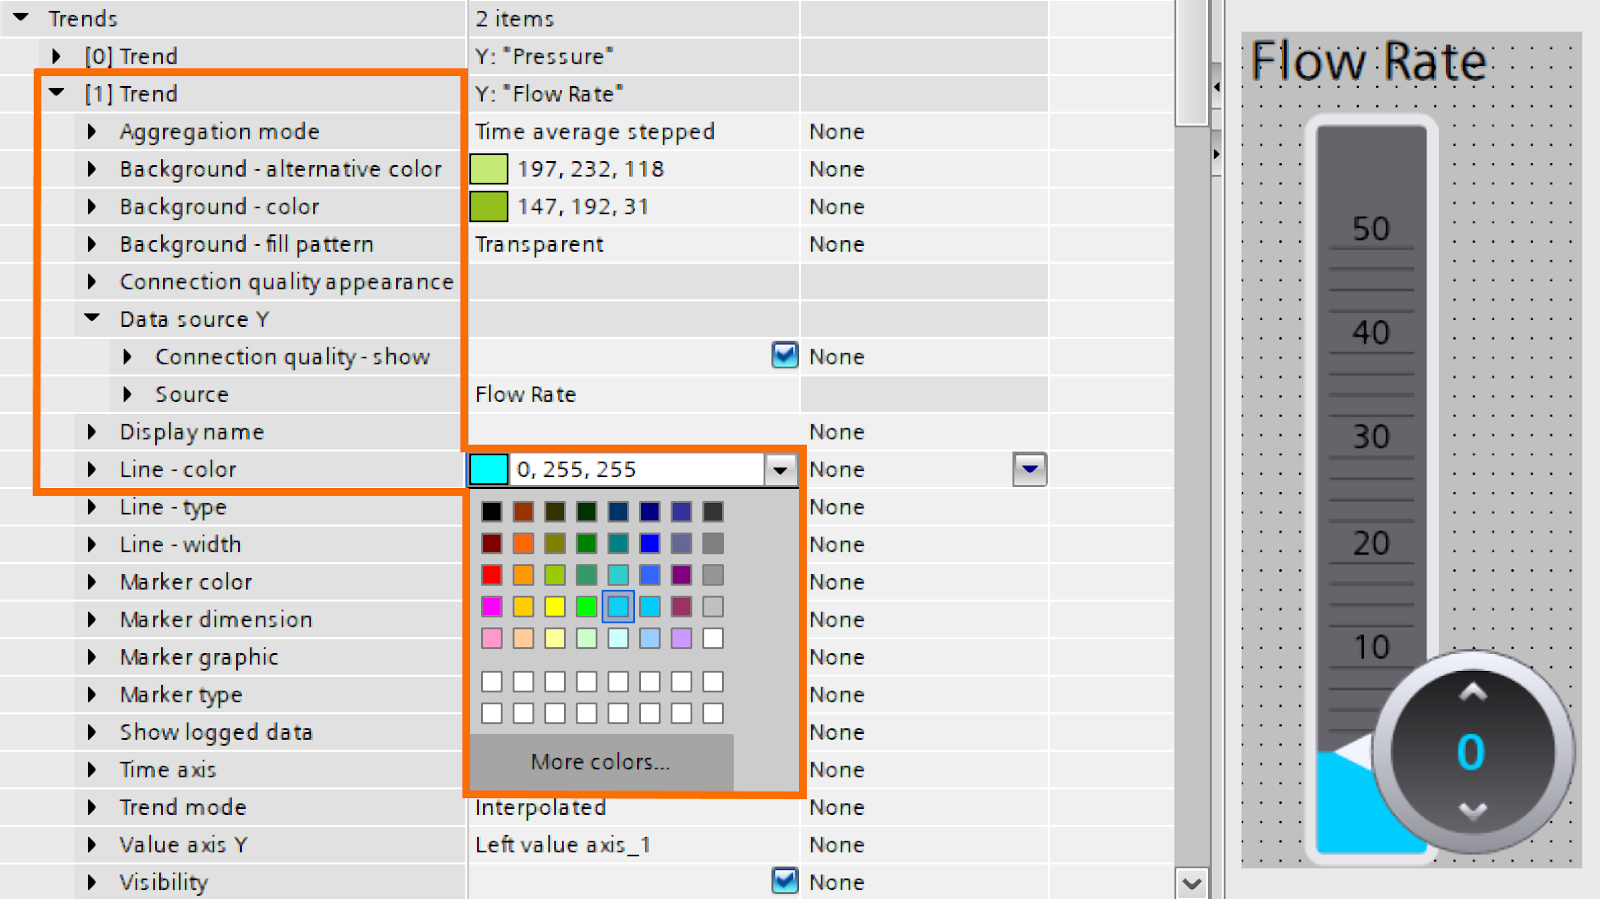
Repeat the same procedure for the second identifier as well. Navigate through the "Trends" item to locate and expand the "Data Source Y" of the "[1] Trend" and connect its "Source" to the "Flow Rate" tag.
Also, change the line color of the second identifier to the color of the "Flow Rate" slider.
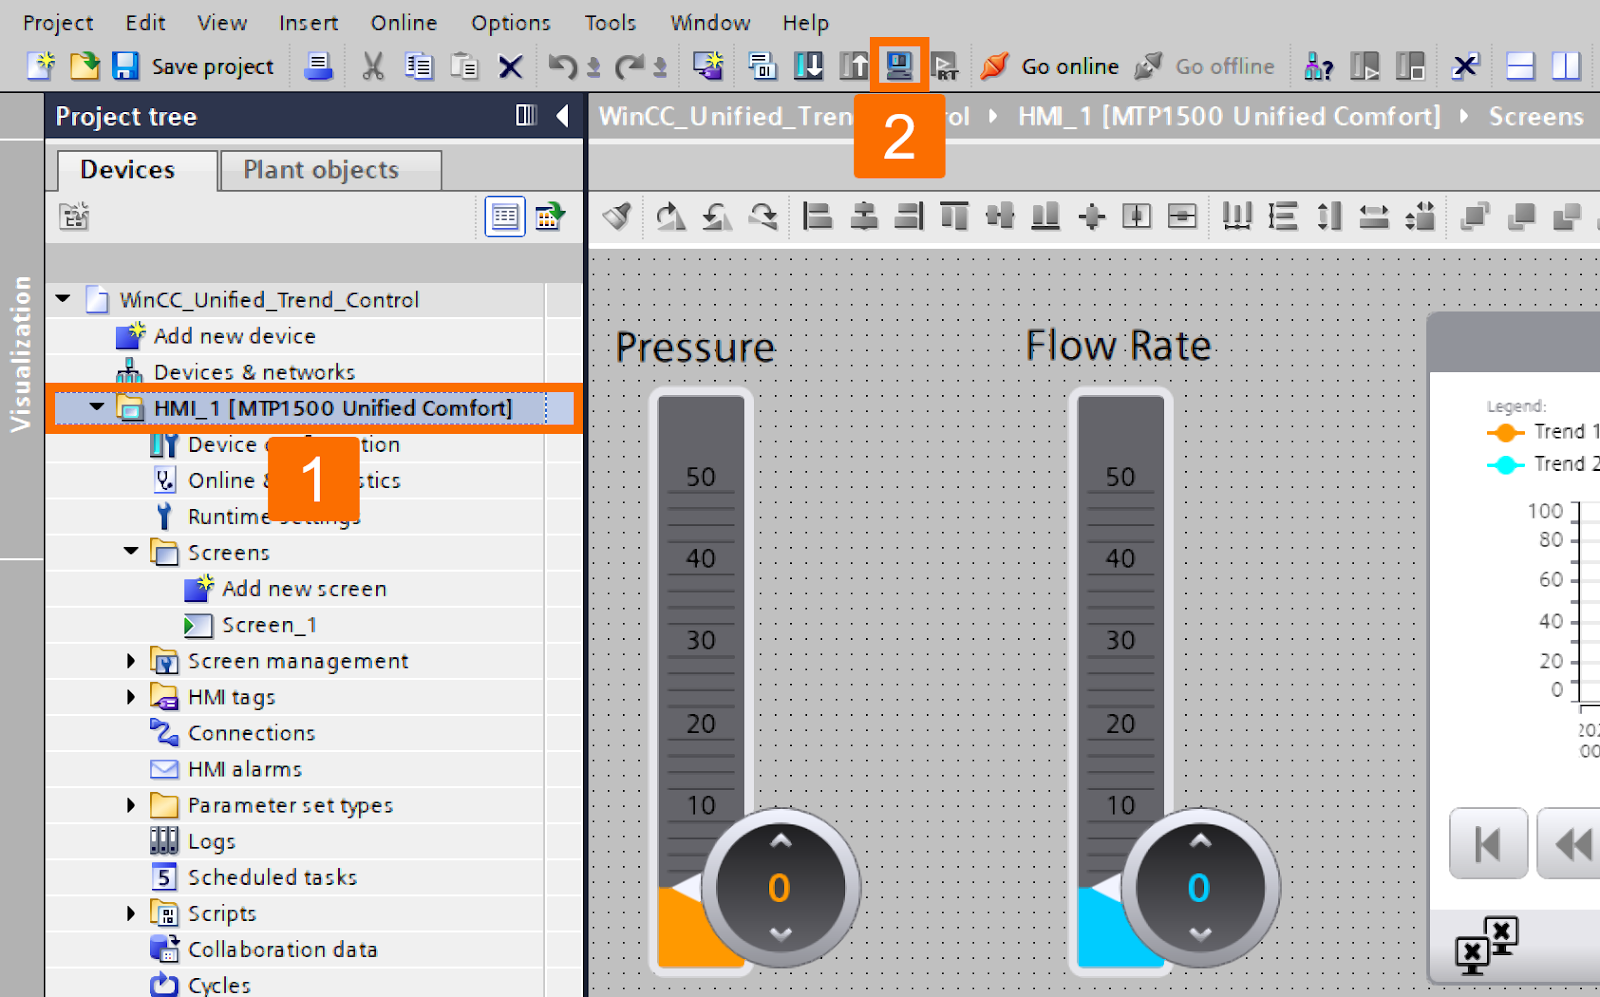
It's time to see the performance of the trend control. To do this, left-click the HMI folder in the project tree and then press the "Start Simulation" icon on the top toolbar.
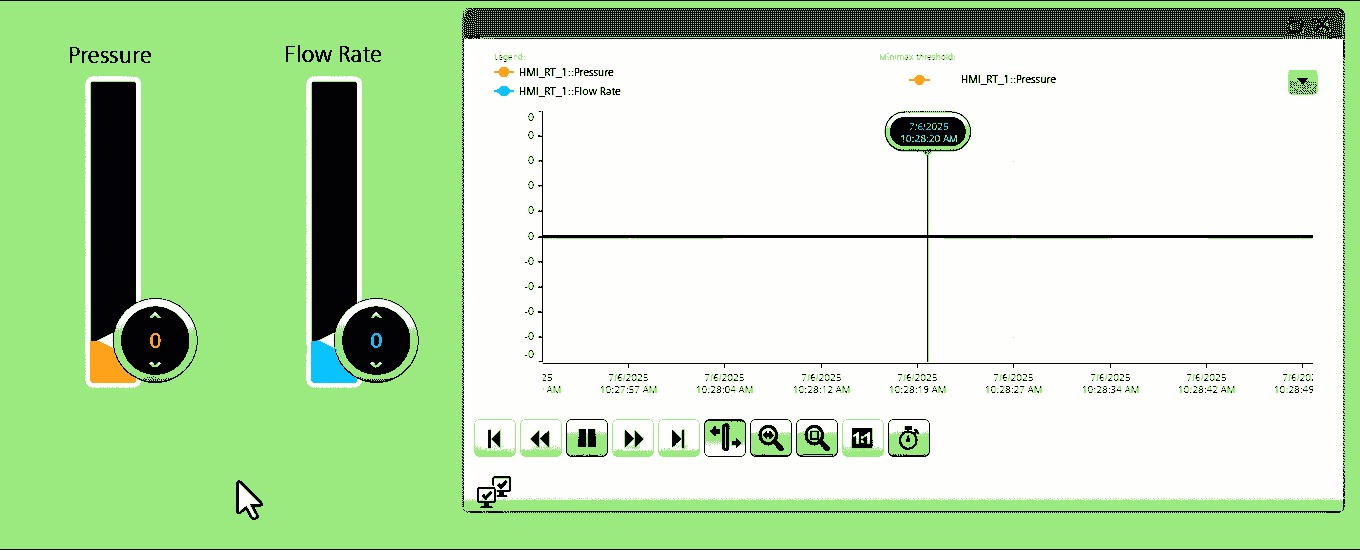
Once the simulation environment runs in your internet browser, use the handles of the sliders to change the values of the "Pressure" and "Flow Rate" tags. As a result, you can see the real-time changes that are happening in the trend control.
Historical Data (Logs)
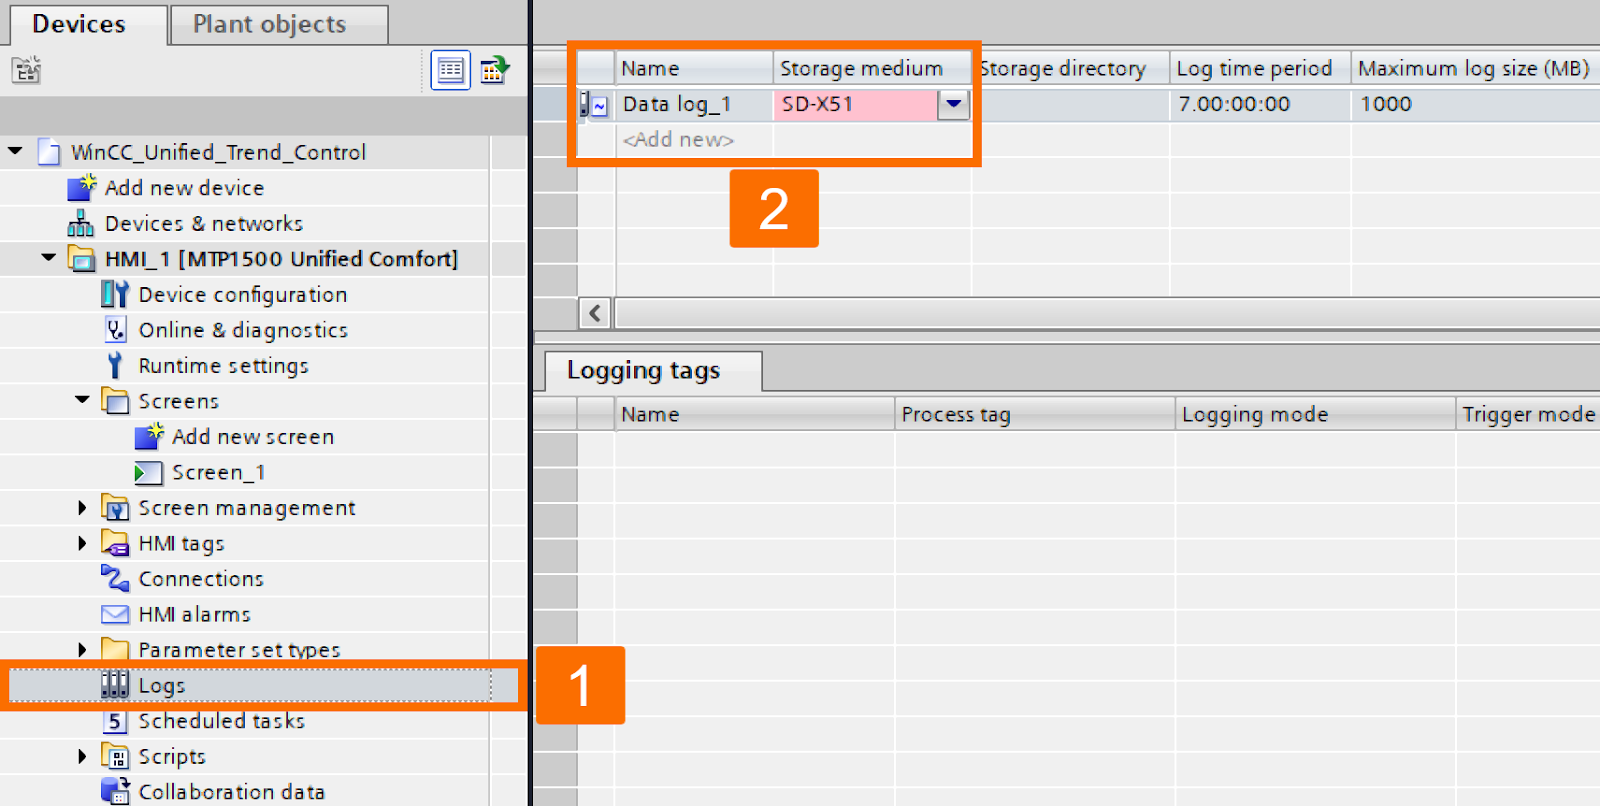
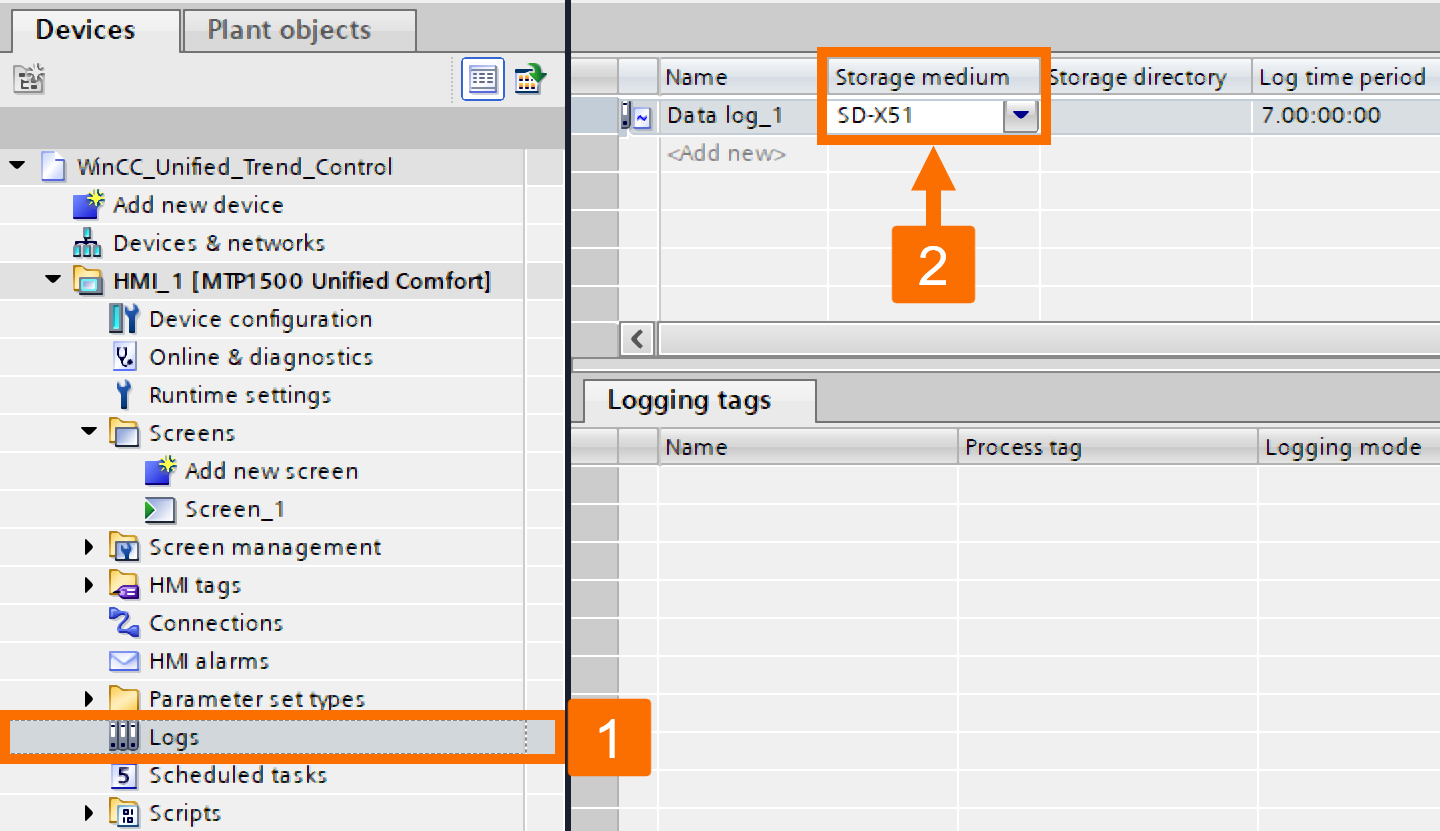
Find the "Logs" item under the HMI folder in the project tree and double-click on it to open its table. You have to create a new log by double-clicking the "<Add New>". The "Storage Medium" of your new log is highlighted in red. The reason is that no logs are allowed if logging is switched off. Here, you have two options: Delete the log, or turn on logging in the runtime settings by specifying a database location.
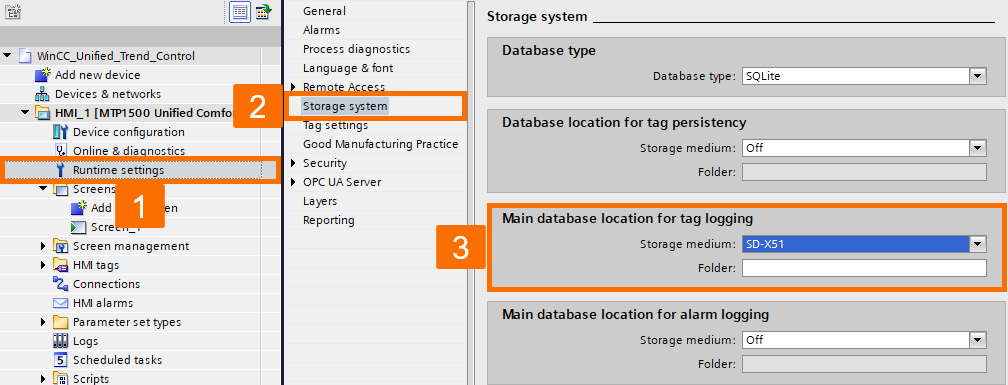
Proceed by activating the "Storage Medium". Open the "Runtime Settings" of your Unified panel and select the "Storage System" item. Under the "Main Database Location for Logging", select the "SD-X51" for the "Storage Medium".
If you return to your log table, you will see that the "Storage Medium" is being accepted.
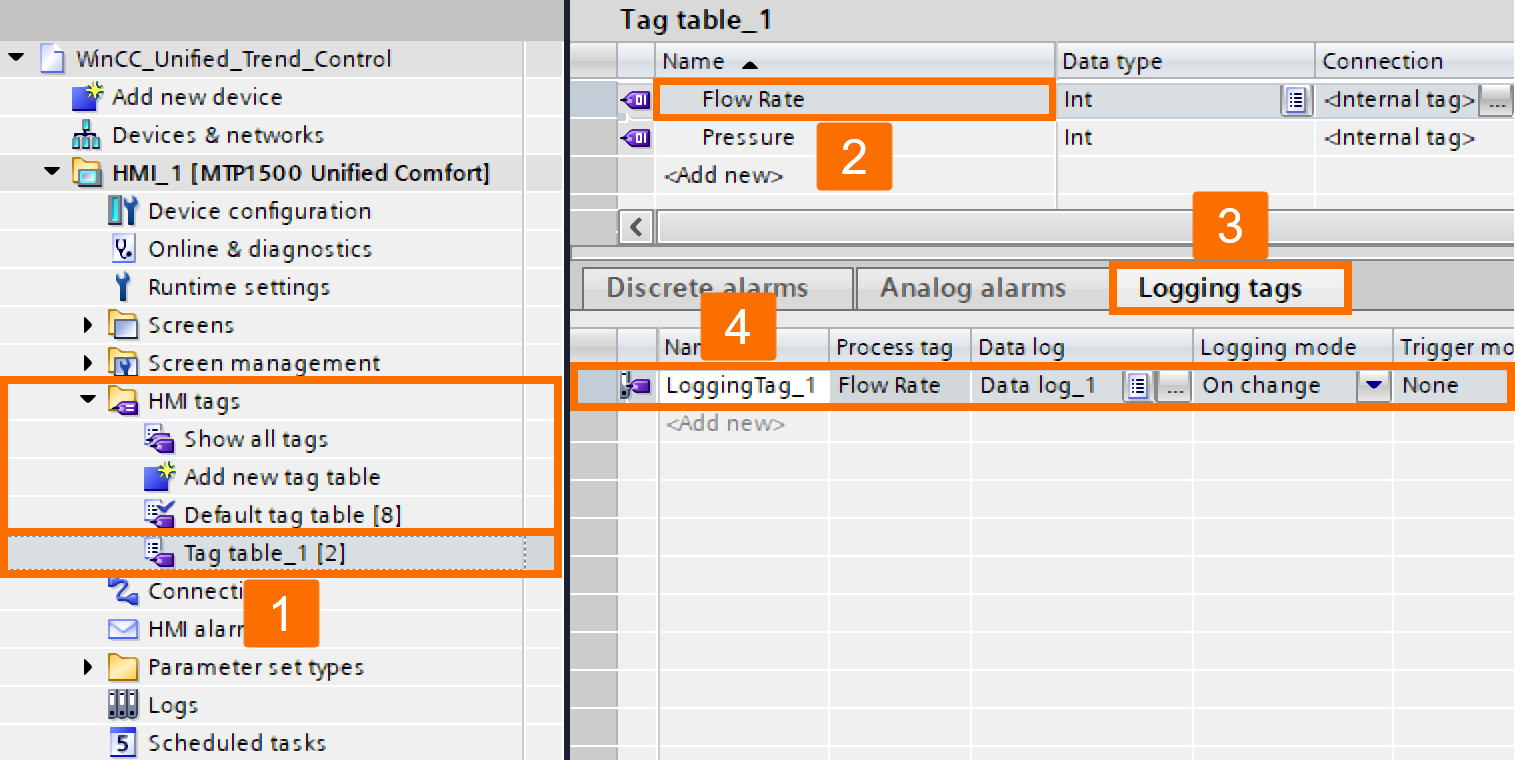
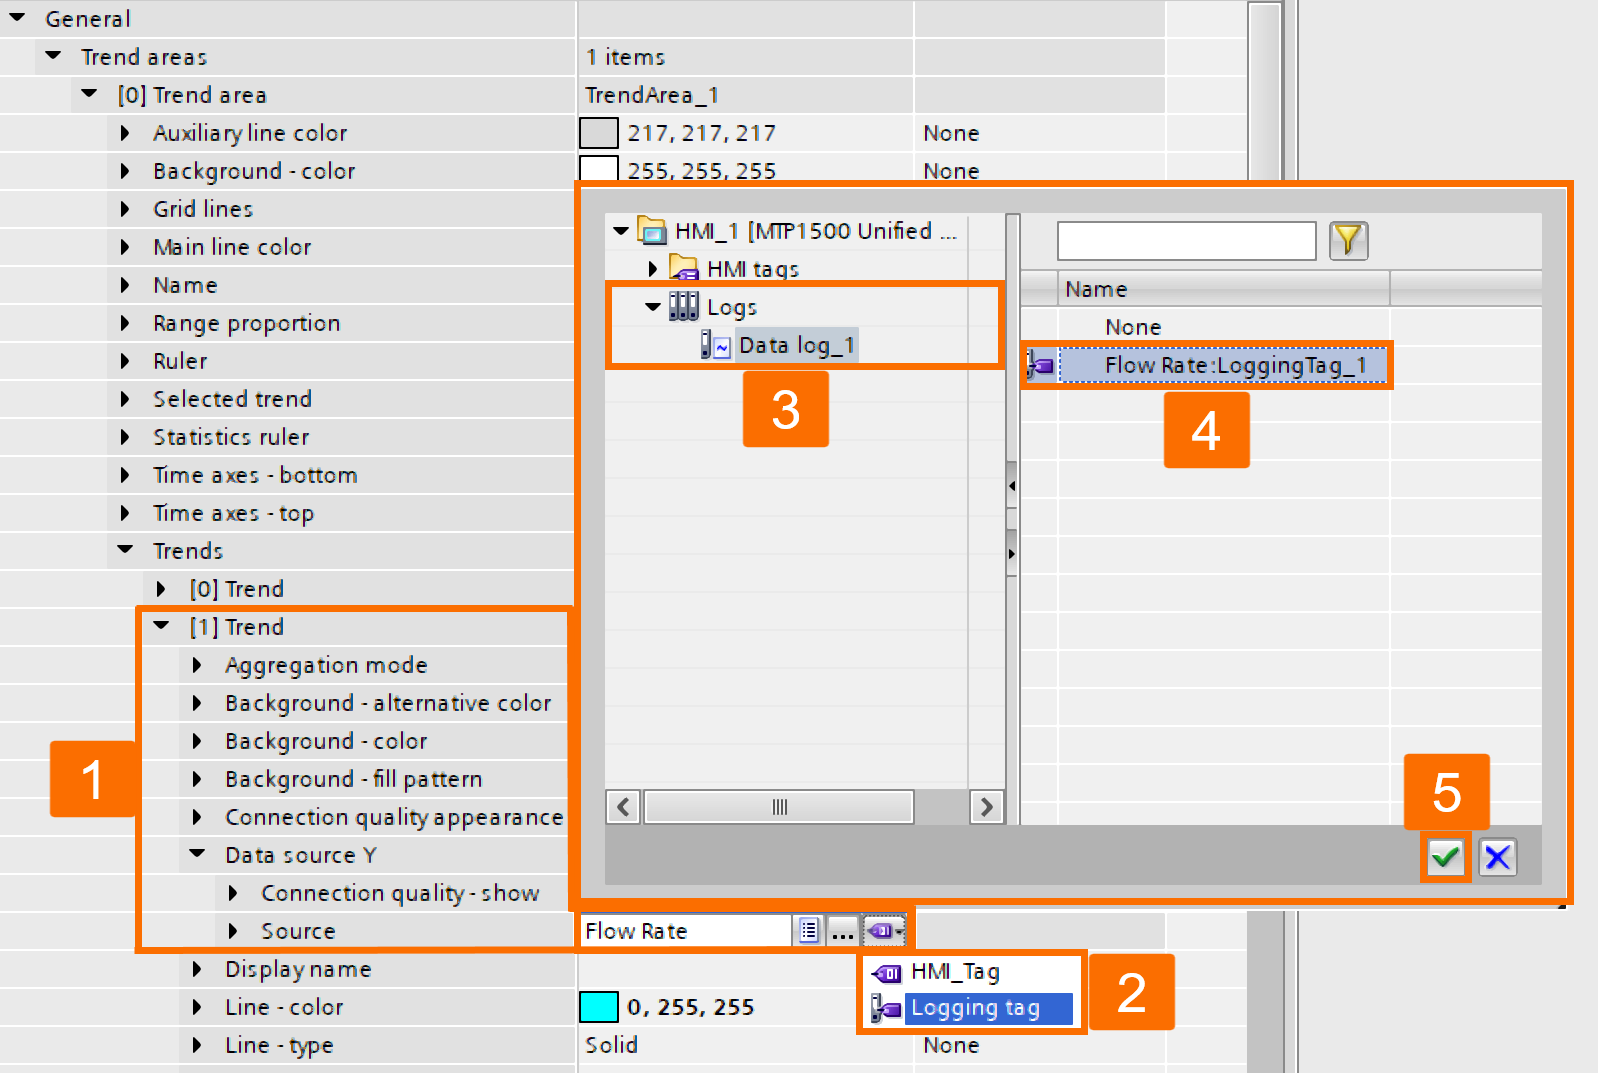
Open your HMI tag table so you can connect your created log with a tag. To do this, select the "Flow Rate" internal tag, left-click the "Logging Tags" tab, and then double-click "Add New".
Return to the main screen, select the inserted "Trend Control" object, and go to its properties window.
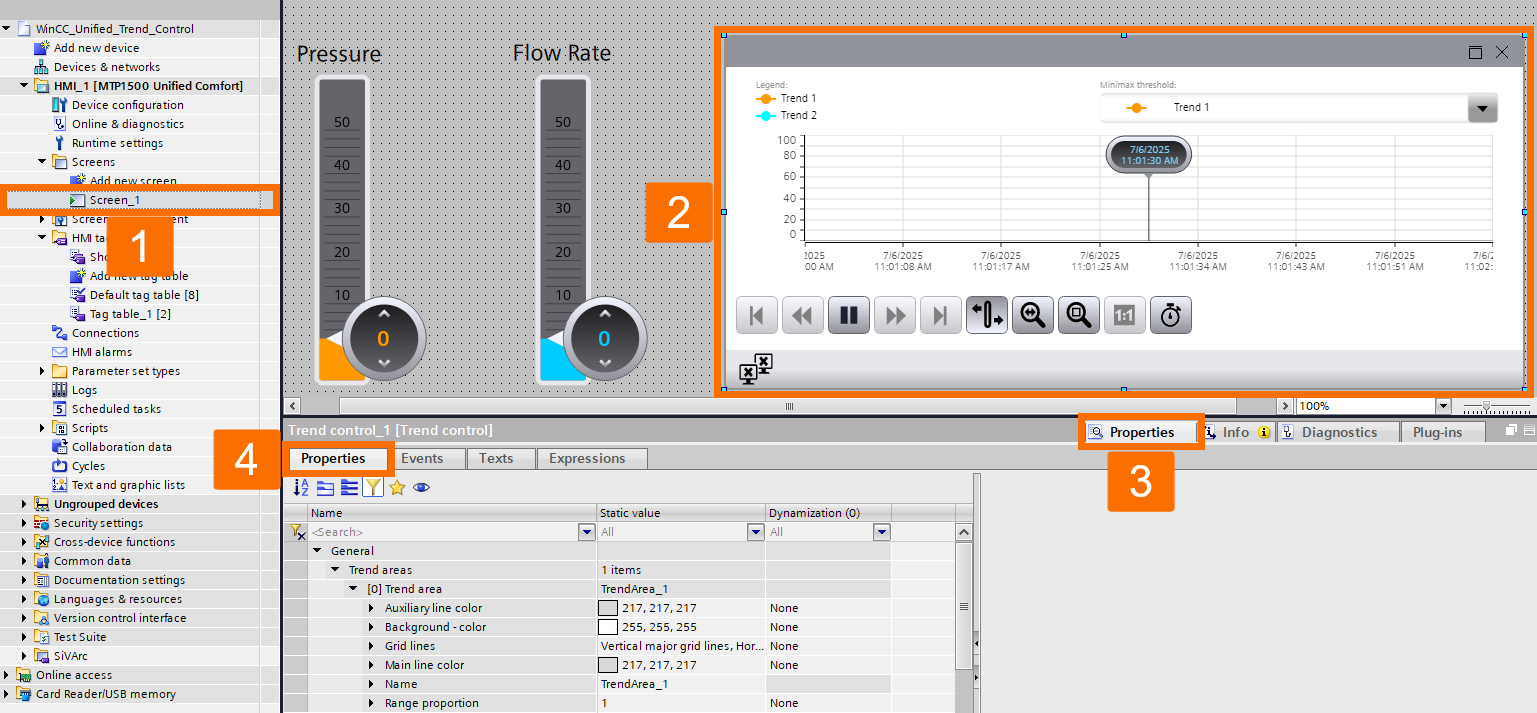
Navigate through the "Trend Areas" to find and expand the "[1] Trend" under the "Trends" item. Find the "Source" within the "Data Source Y" of the "[1] Trend" and reconnect the "Flow Rate" tag, this time, to the logging tag.
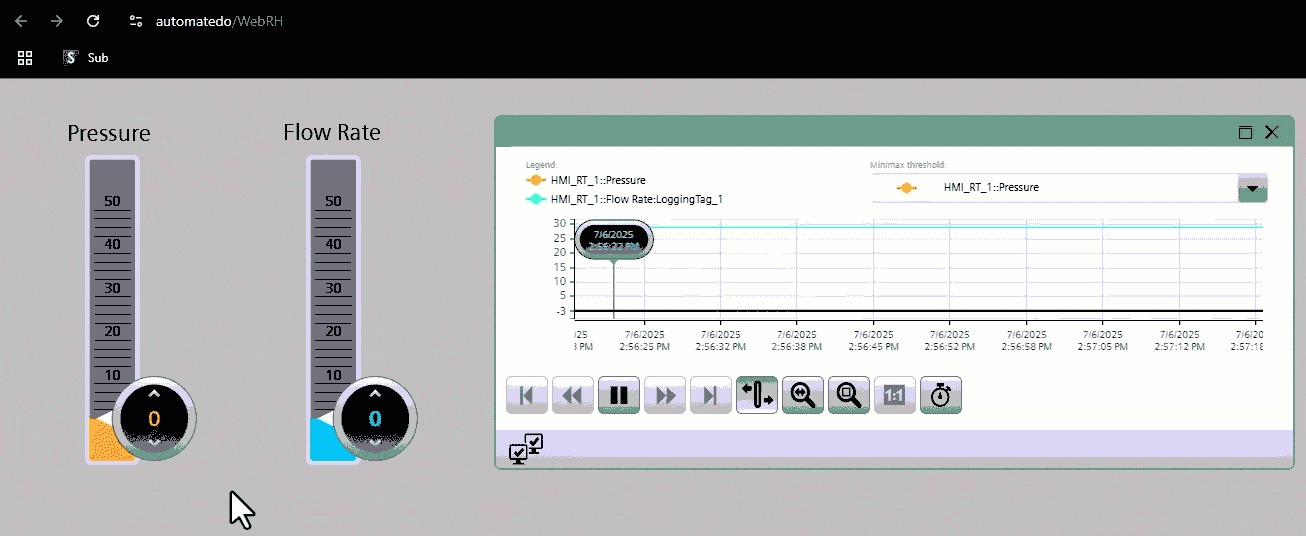
Select the HMI folder in the project tree and then press the "Start Simulation" icon on the top toolbar to evaluate the performance of your data log. Once the simulation environment is opened in your internet browser, use the handles of the sliders to change the values of the internal tags. Then, refresh your internet browser page, and you will see that only the data log of the "Flow Rate" tag is being saved.
Exporting Data
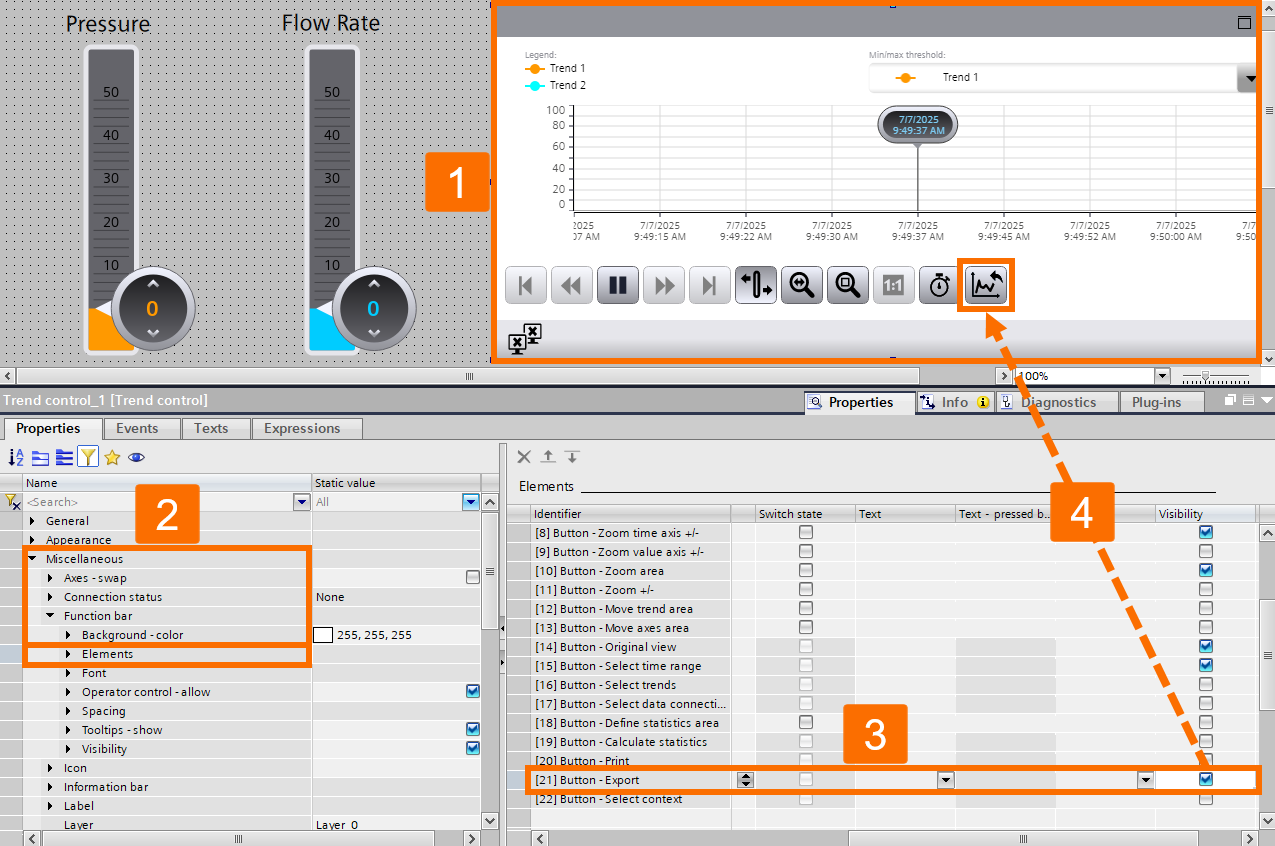
Once again, go to the properties of the trend control object. Navigate through the "Miscellaneous" section to find and left-click the "Elements" under the "Function Bar" item. Once the "Elements" table opens, scroll down to locate the "[21] Button - Export" and check its visibility checkbox. As a result, this button appears on the control trend object.
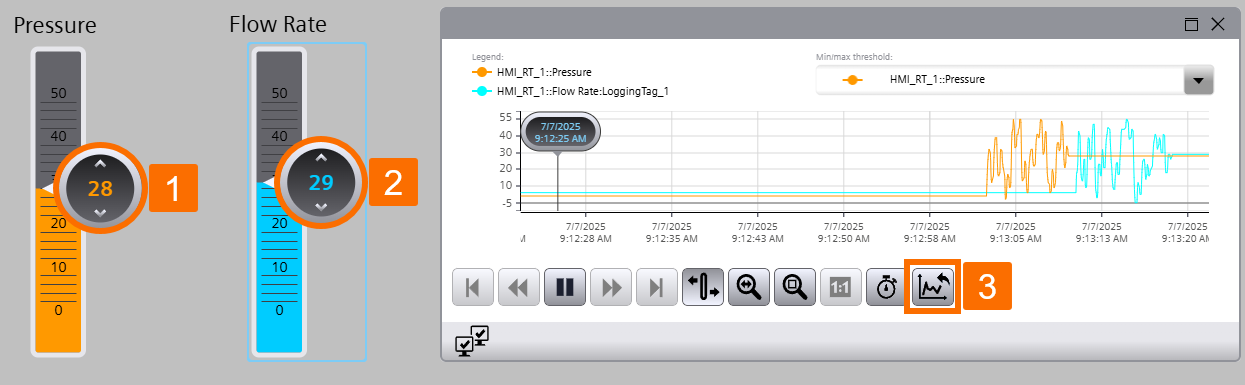
Launch the simulation environment associated with the Unified HMI. Once operational, locate the sliders and use their handles to manipulate and adjust the current values of the panel's internal tags. Following these modifications, press the "Export" button to proceed.
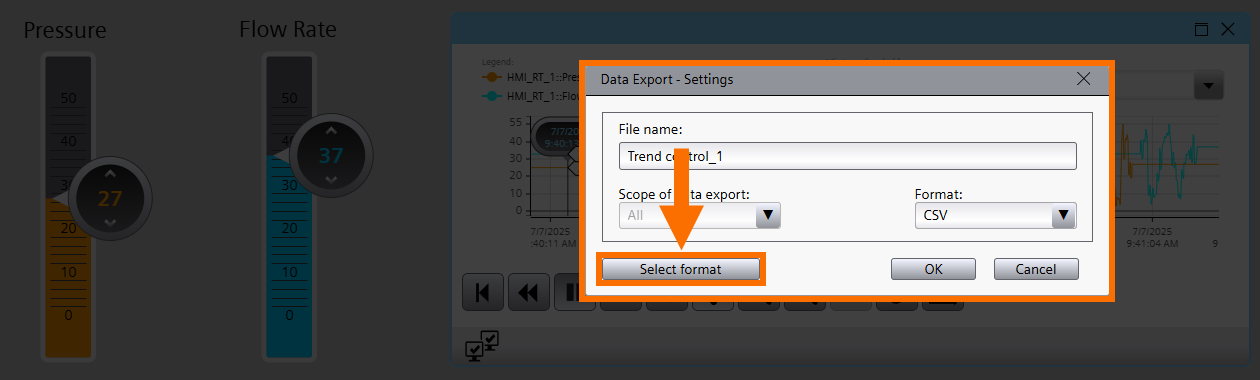
When the "Data Export - Settings" window is opened, hit the "Select Format" button.
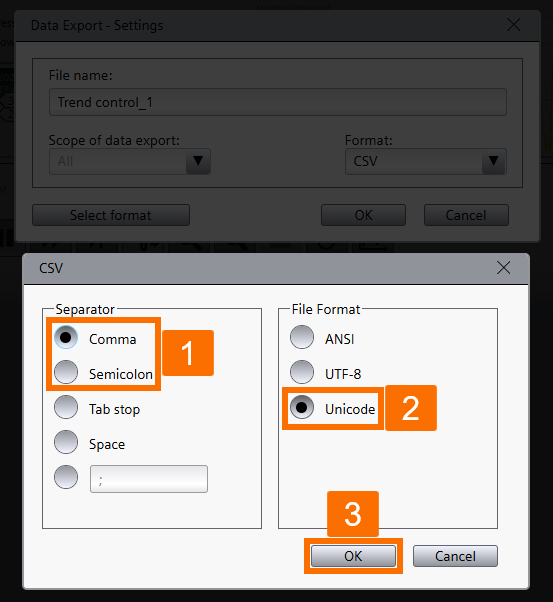
For your data log, select the "Comma" as the separator and the "Unicode" as the "File Format", and press the OK button.
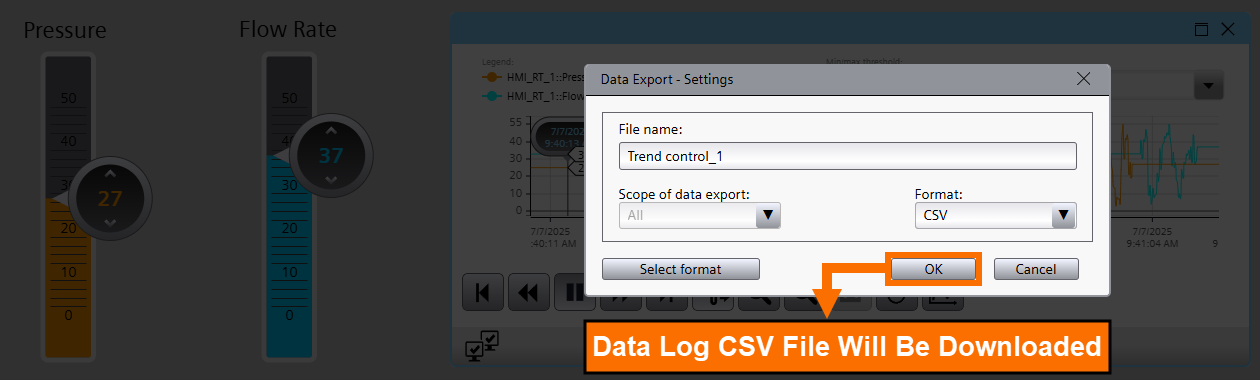
Once the "Data Export - Settings" window is configured, pressing the OK button is the essential trigger that starts the process of downloading the corresponding data log CSV file.
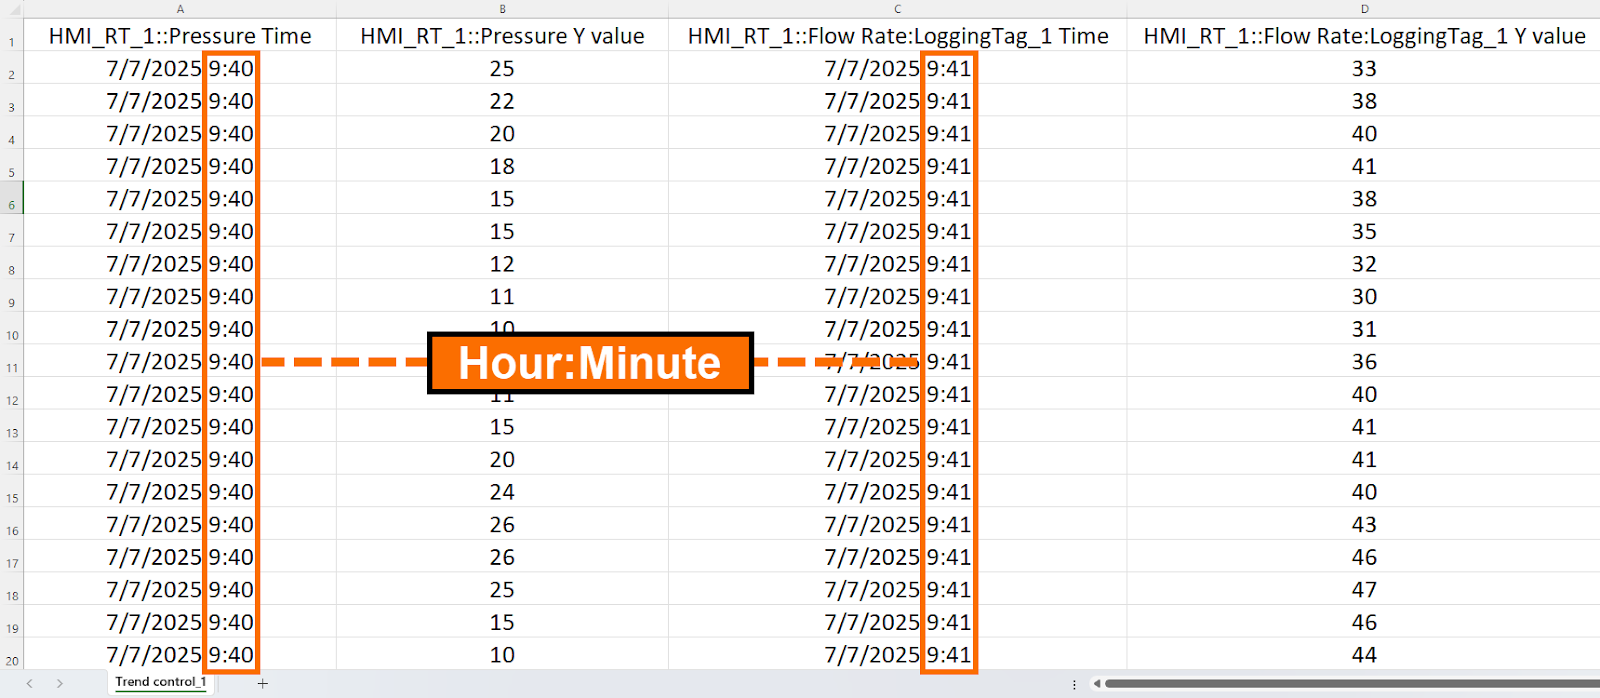
After you download the CSV file, open it. As you can see, the time of data is shown in the format of hours and minutes only.
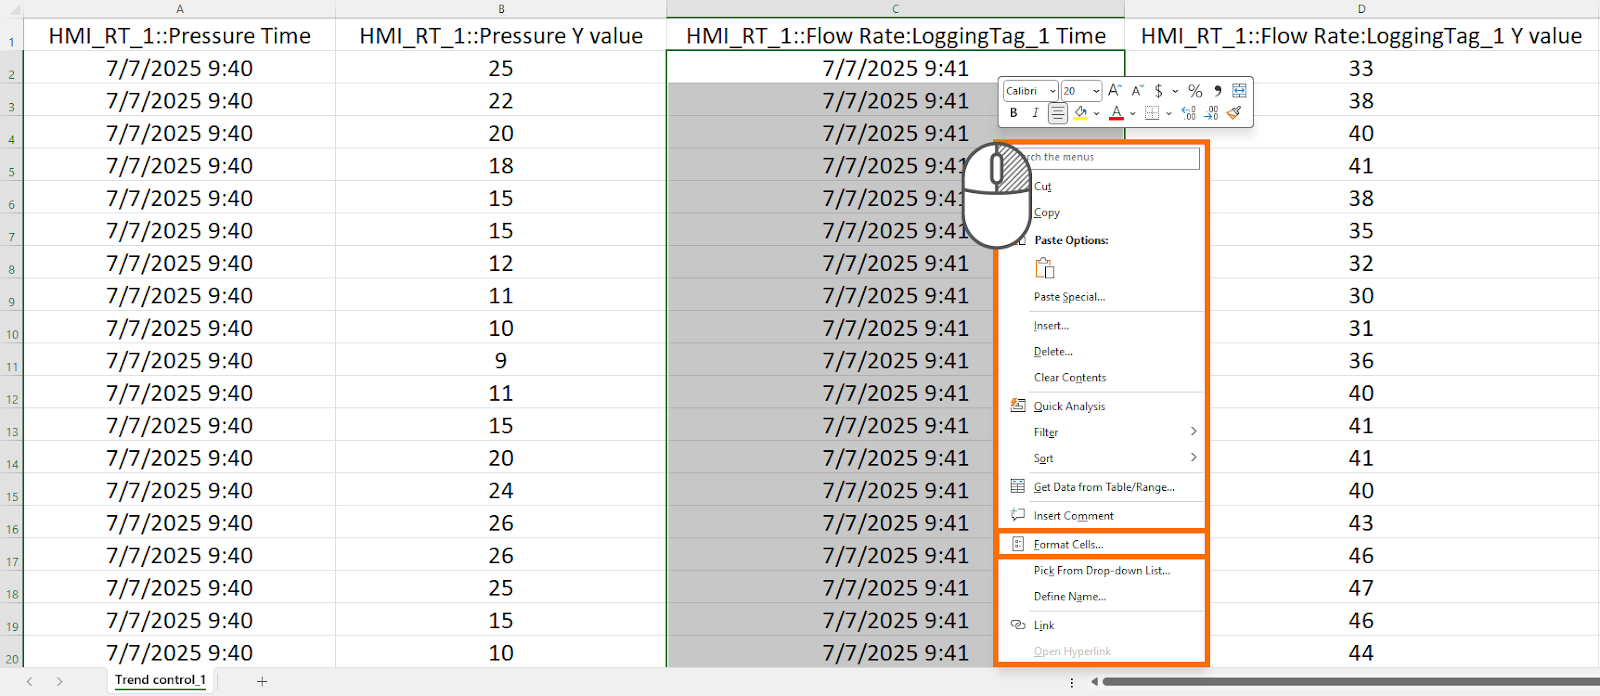
You can change the time format in Excel to include the "s" and "ms" (seconds and milliseconds) as well. To do this, select your desired data time column, right-click, and choose "Format Cells."
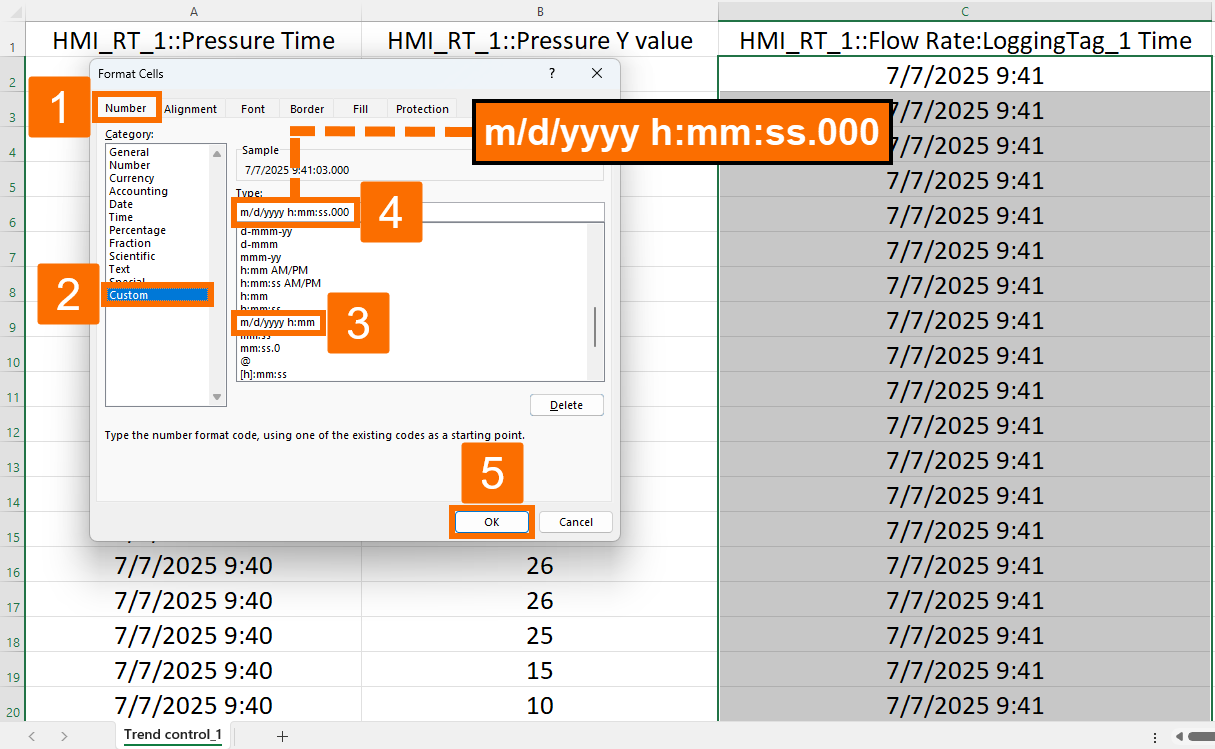
Once the "Format Cells" window is opened, select the "Number" tab, choose the "Custom" category, modify the format of "month-day-year hour-minute" to "month-day-year hour-minute-second-millisecond", and press the OK button.
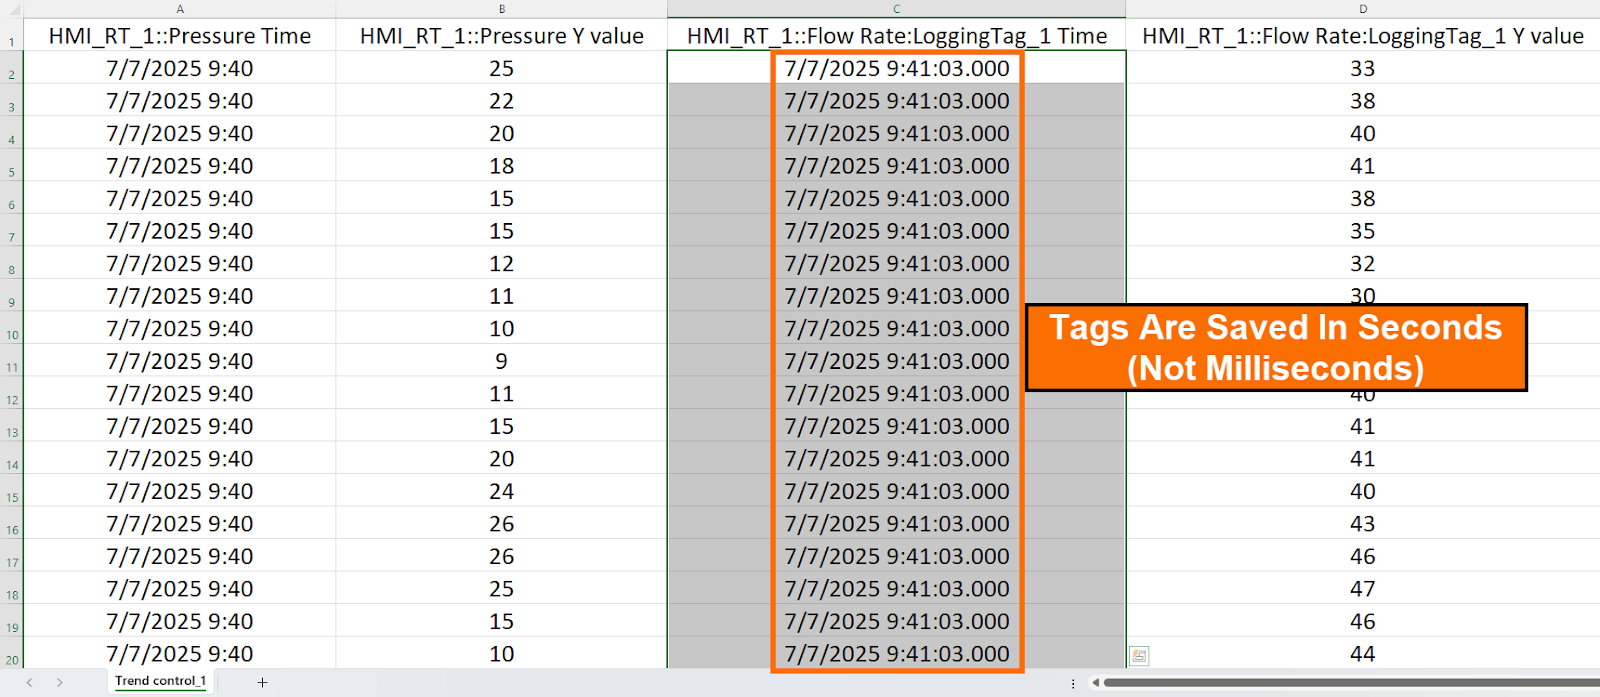
Upon reviewing the current data, it becomes evident that the tag timestamps are recorded exclusively with second-level granularity, meaning millisecond precision is missing from the saved values.
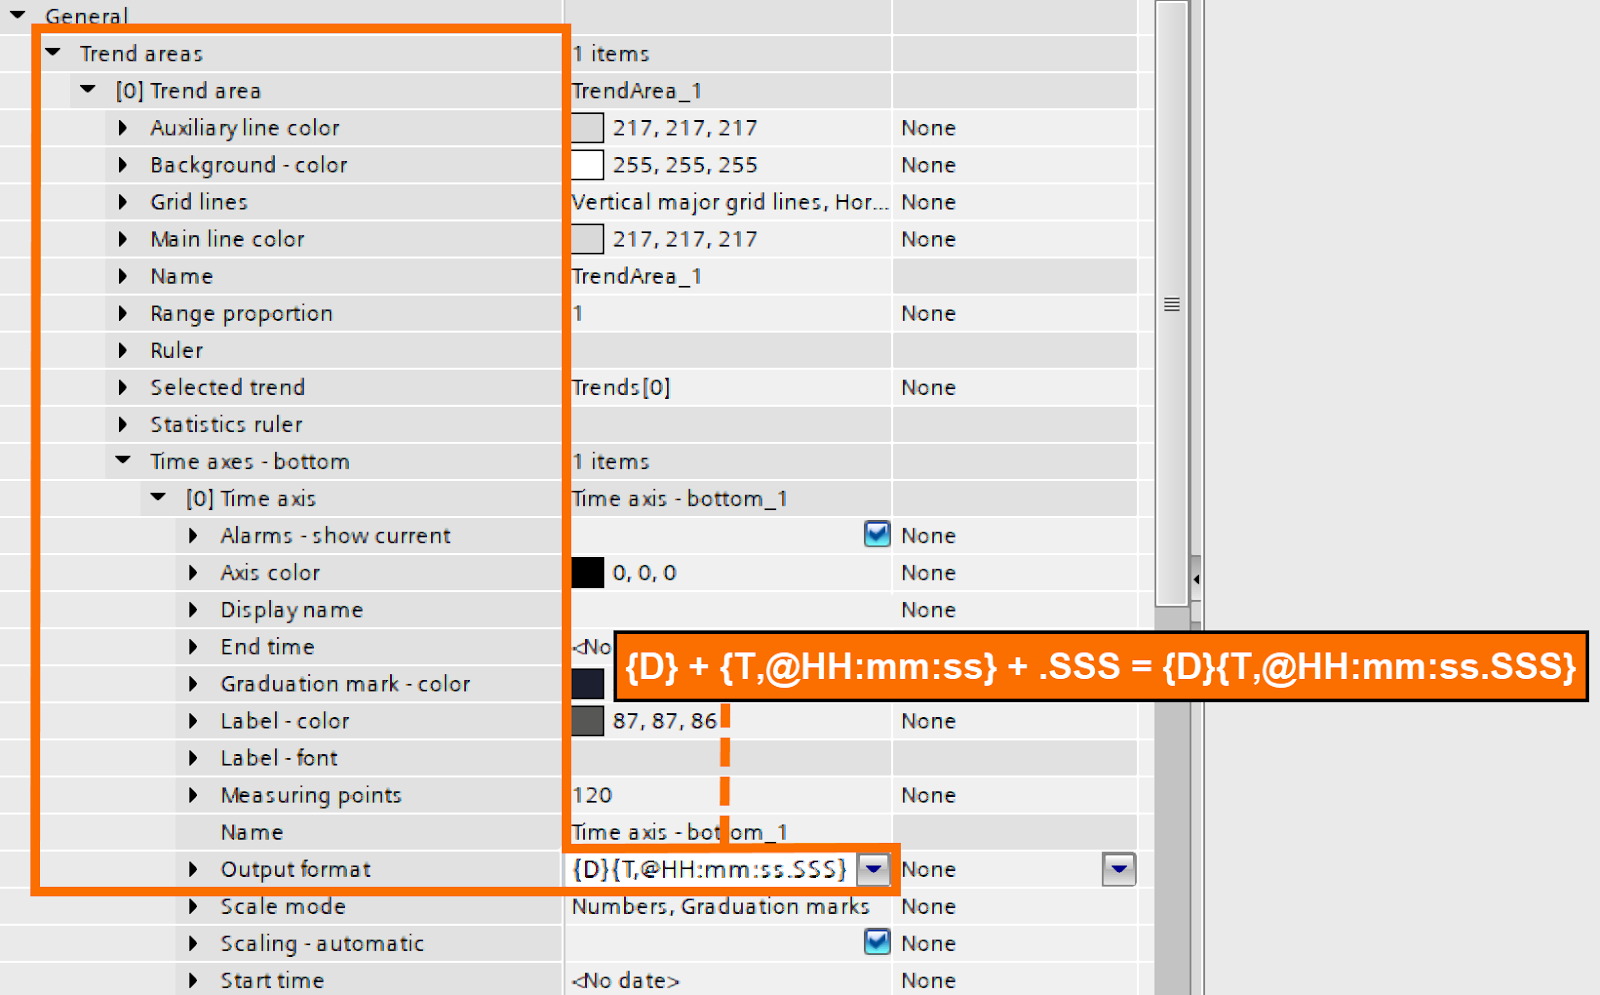
To fix this issue, return to the TIA Portal software and open the properties of the trend control object. Navigate through the "Trend Areas" to find and expand the "Time Axes - Bottom" item. You have to change the "Output Format" of time and date to "{T,@HH:mm:ss}". However, you need to implement the ".SSS" and "D" to this format to conclude "{D}{T,@HH:mm: ss.SSS} " as your final format.
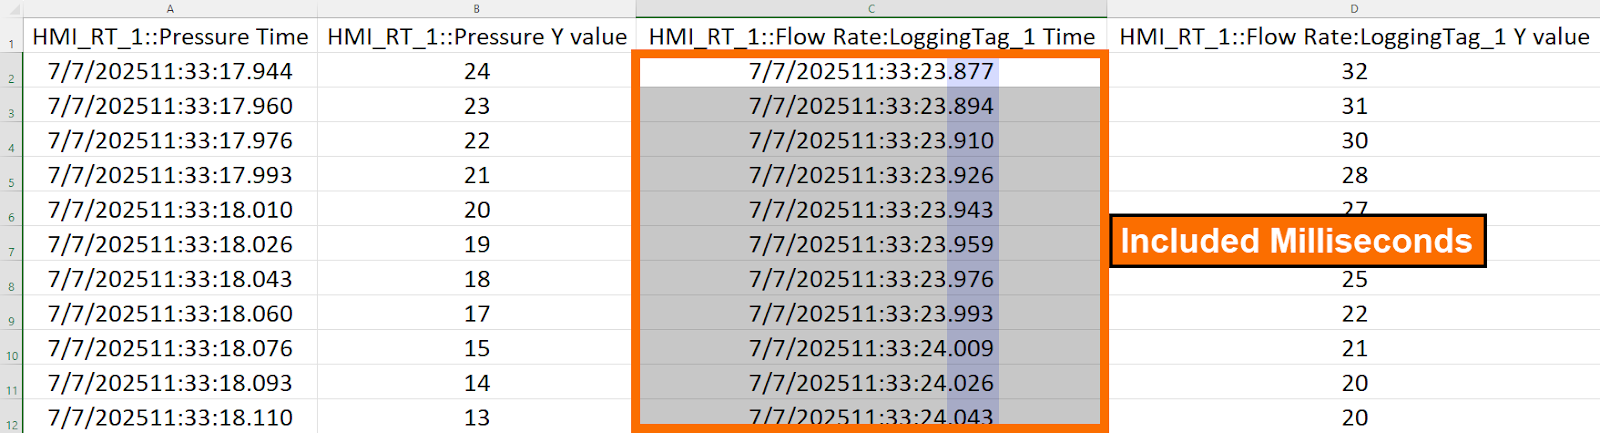
Should you choose to execute the data log CSV download procedure a second time and subsequently open the retrieved file, you will now discover that all tag timestamps incorporate millisecond-level precision in their saved values.
Conclusion
In conclusion, you've learned how to establish a solid data visualization framework using WinCC Unified Trend Control. You started in TIA Portal, set up real-time trend monitoring for key variables like pressure and flow rate, and got those interactive sliders working as intended. After that, you shifted gears to historical data logging, configured the storage, mapped the suitable tags, and ensured your data is not vanishing into the void. You also handled data export and made sure you could generate CSV files with precise timestamps, right down to the millisecond. With this toolkit, you're now prepared to set up comprehensive monitoring systems for industrial processes. You'll be able to track live data, revisit past events, and troubleshoot with more confidence.
